Components
15 chart types. Every one is free in Instrument; the paid themes restyle them, same props.
45 results
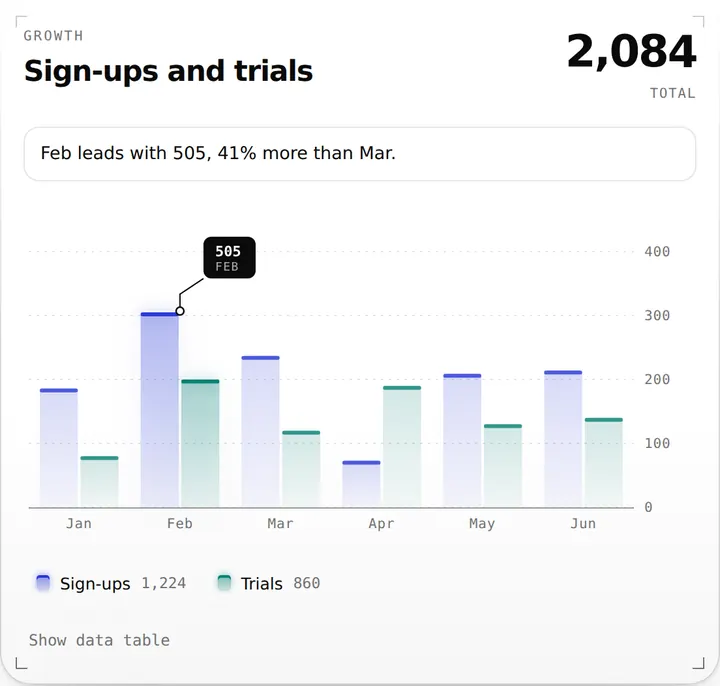
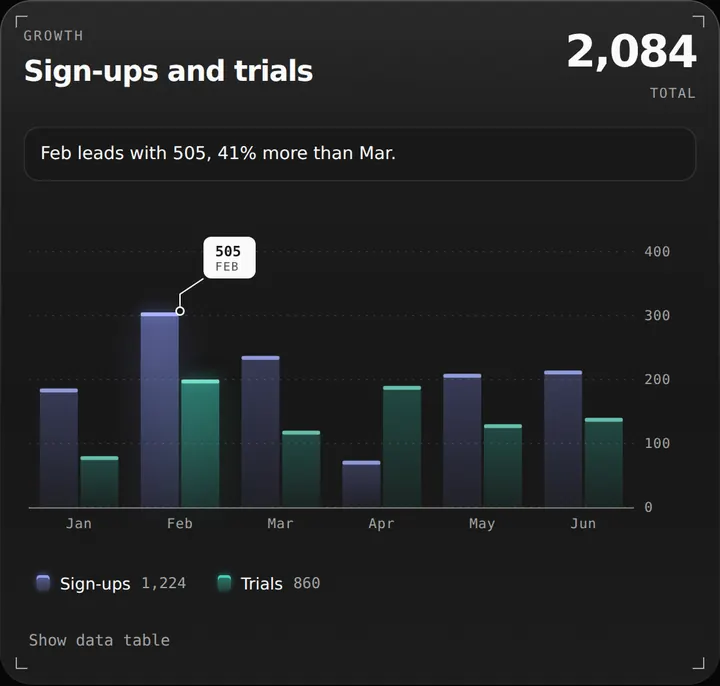
Bar chart
FreeInstrumentGrouped, stacked or 100%, vertical or horizontal, with a measured callout and a computed takeaway
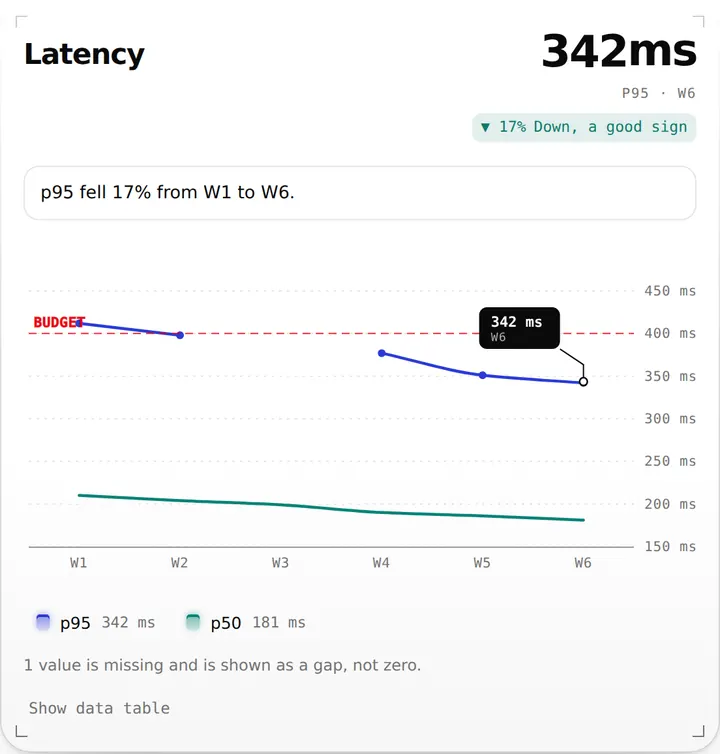
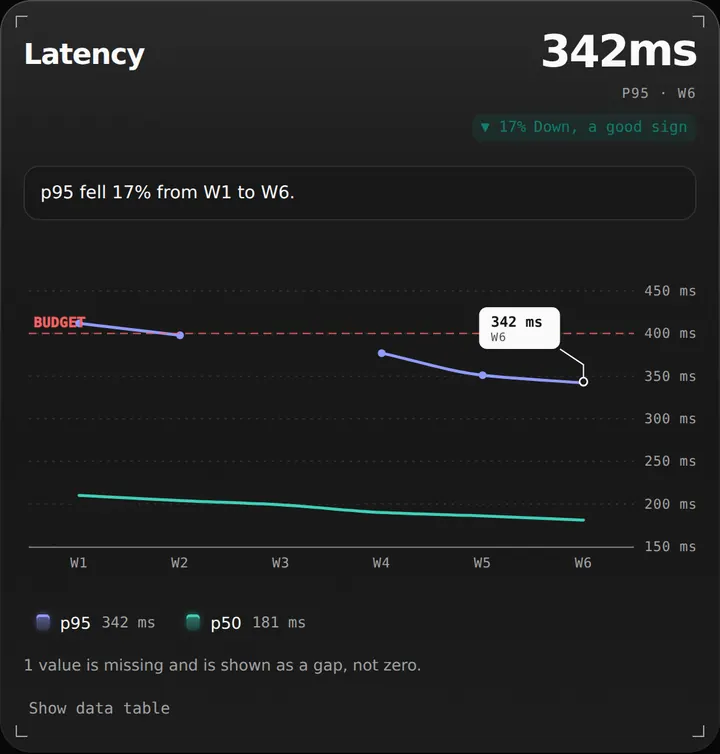
Line chart
FreeInstrumentTrends with honest gaps, forecast tails, references and a latest-value readout
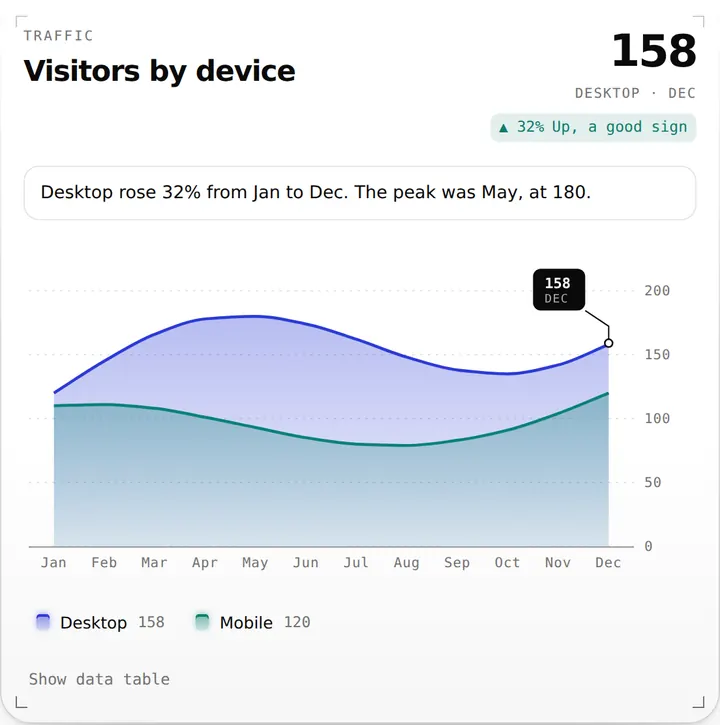
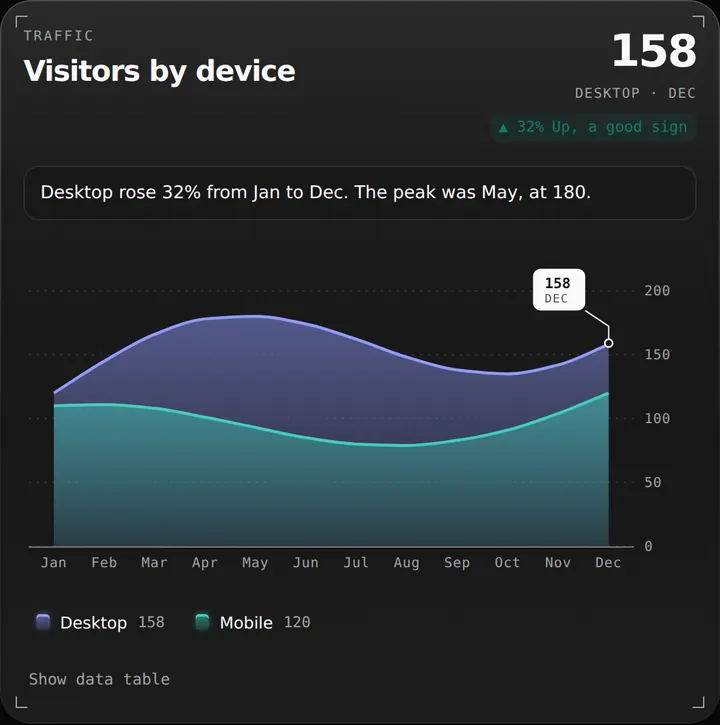
Area chart
FreeInstrumentOverlaid, stacked or 100% areas with gaps kept and forecast tails
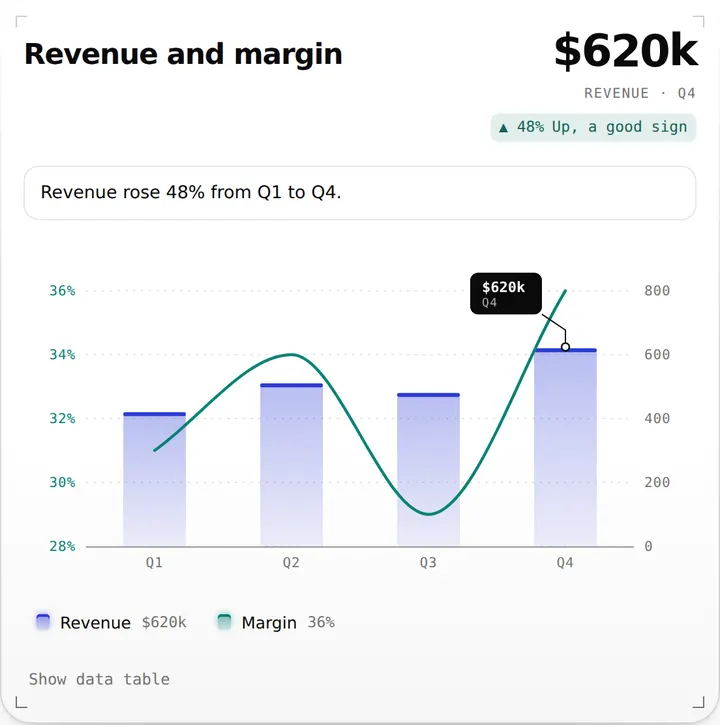
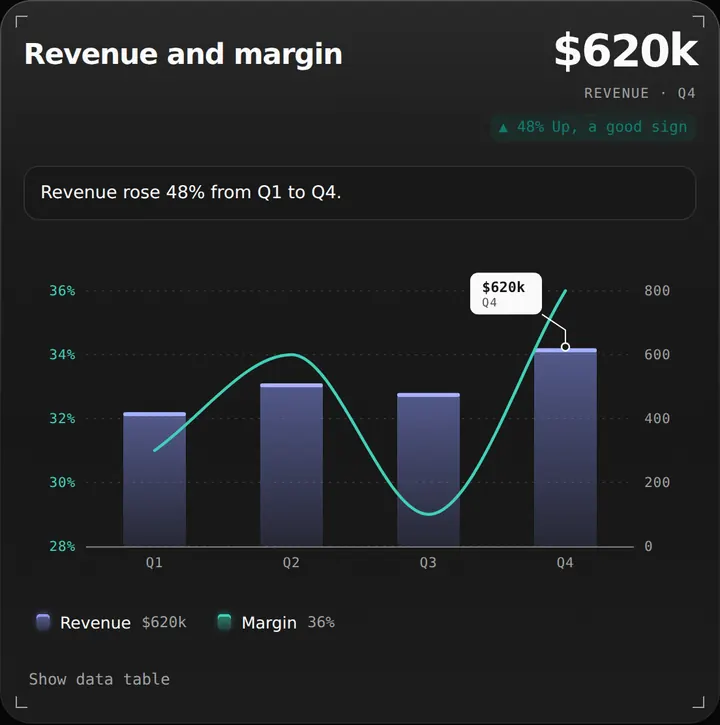
Composed chart
FreeInstrumentBars, lines and areas together, with a second value axis
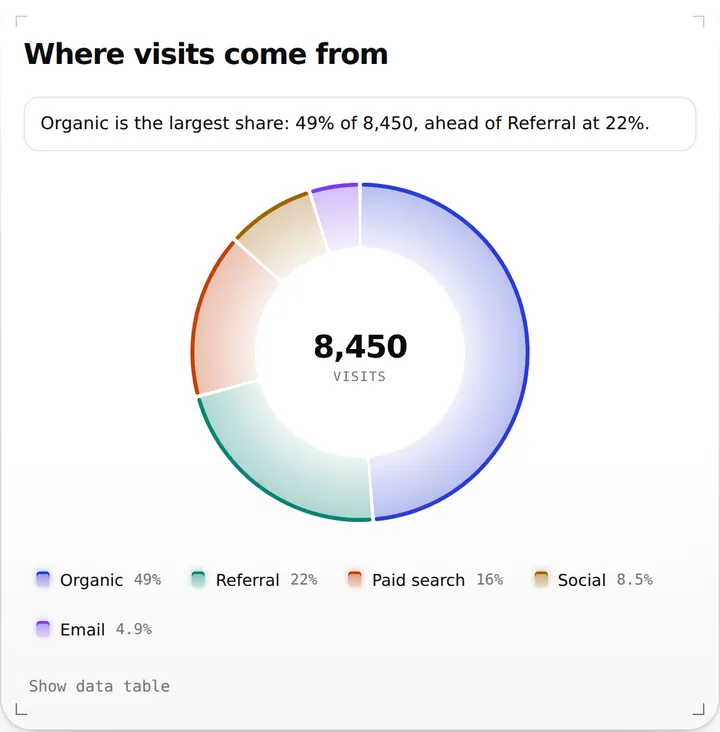
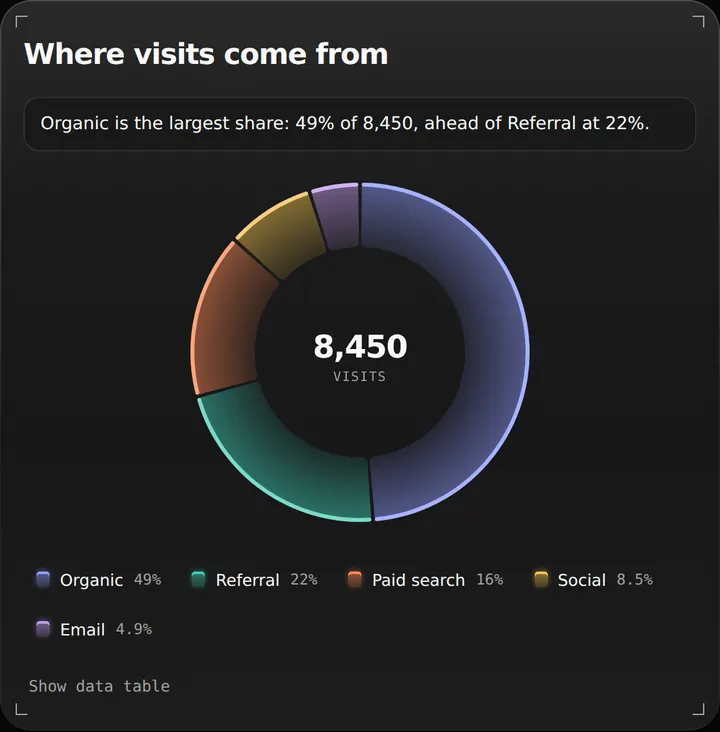
Donut chart
FreeInstrumentDonut or pie with Other grouping, honest exclusions, labels inside or outside and a centre readout
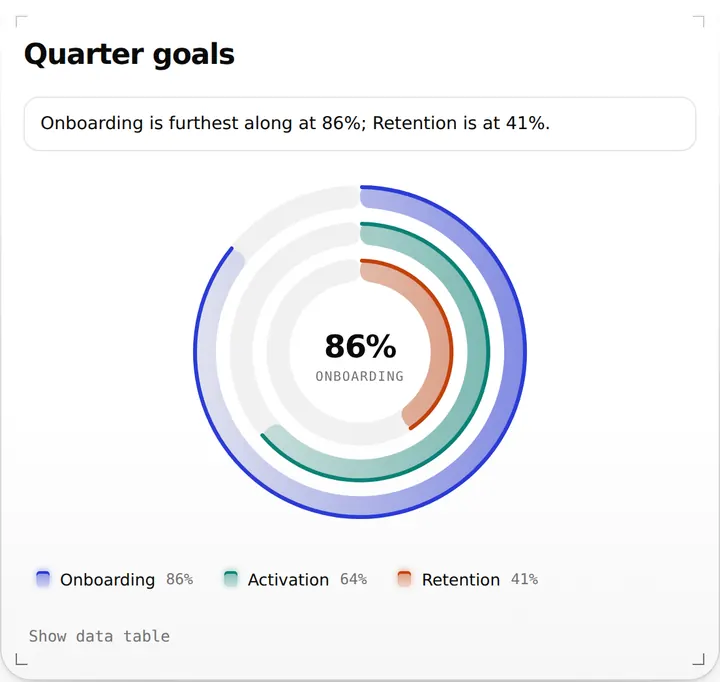
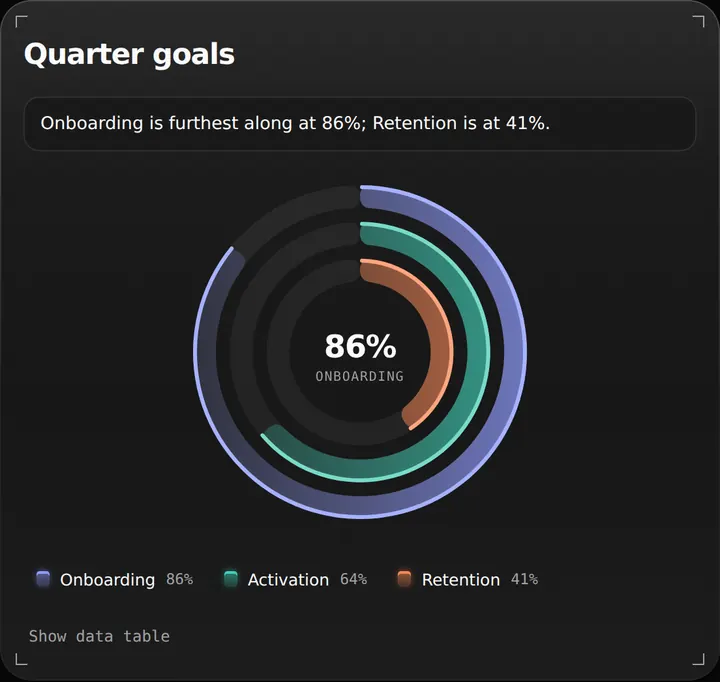
Radial chart
FreeInstrumentProgress rings, full or half, with goals and honest overflow
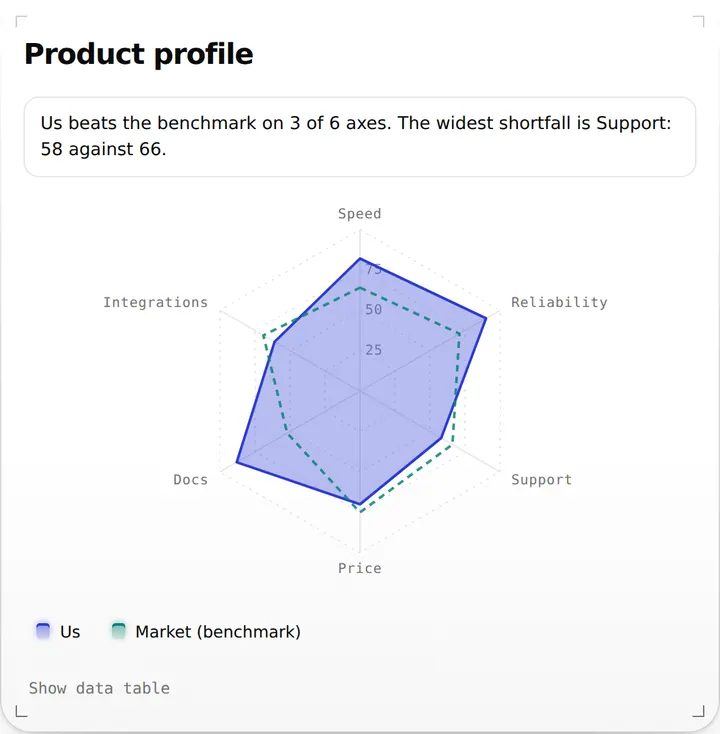
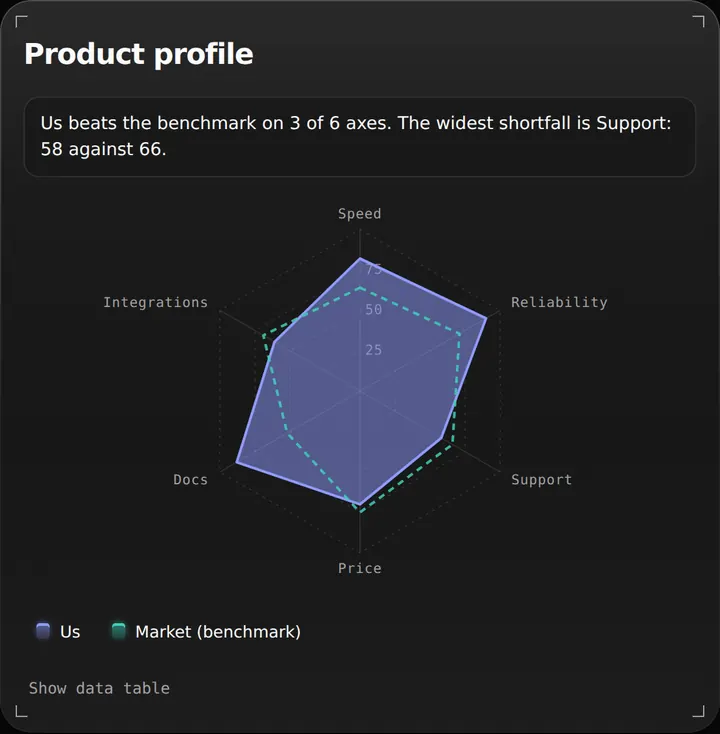
Radar chart
FreeInstrumentProfiles across axes with per-axis ranges, honest gaps and an optional benchmark
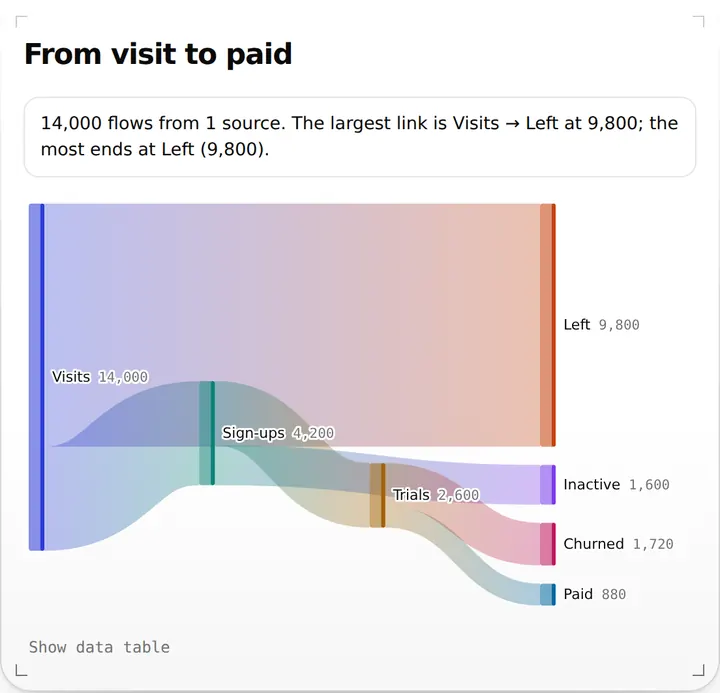
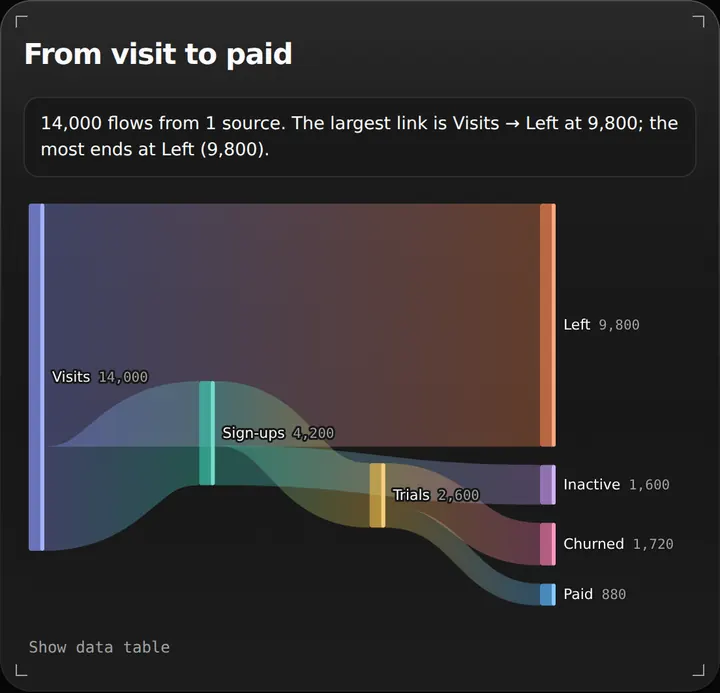
Sankey chart
FreeInstrumentFlows with validation, disclosures and path tracing. Same props and layout on both engines
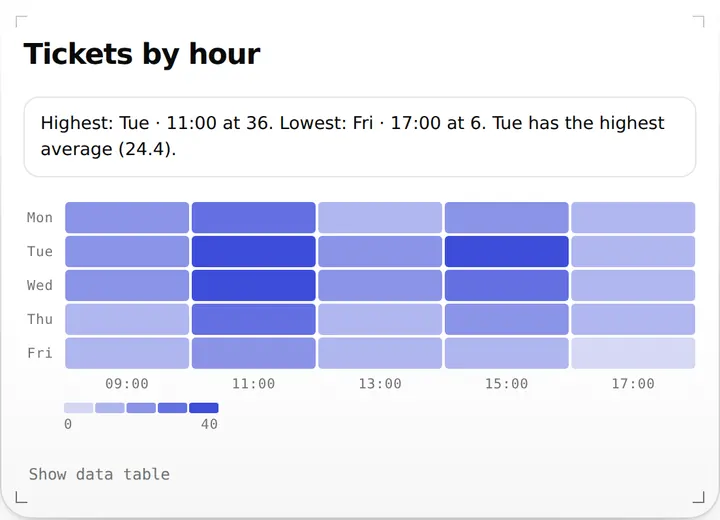
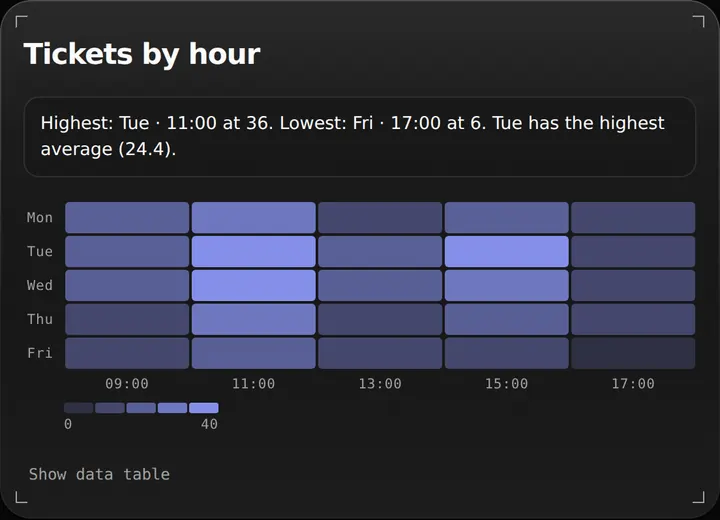
Heatmap
FreeInstrumentA matrix or calendar heatmap with a stepped or diverging scale and empty outlines for missing cells. Plain SVG: no chart engine
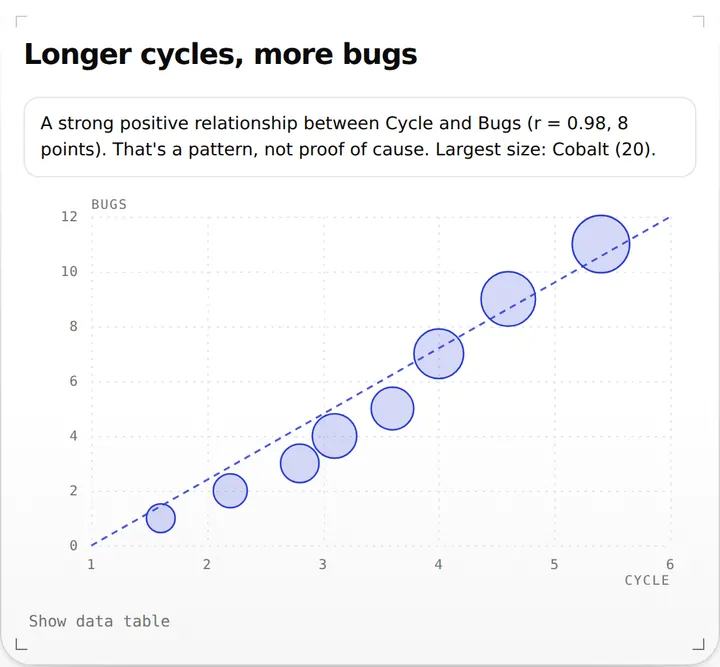
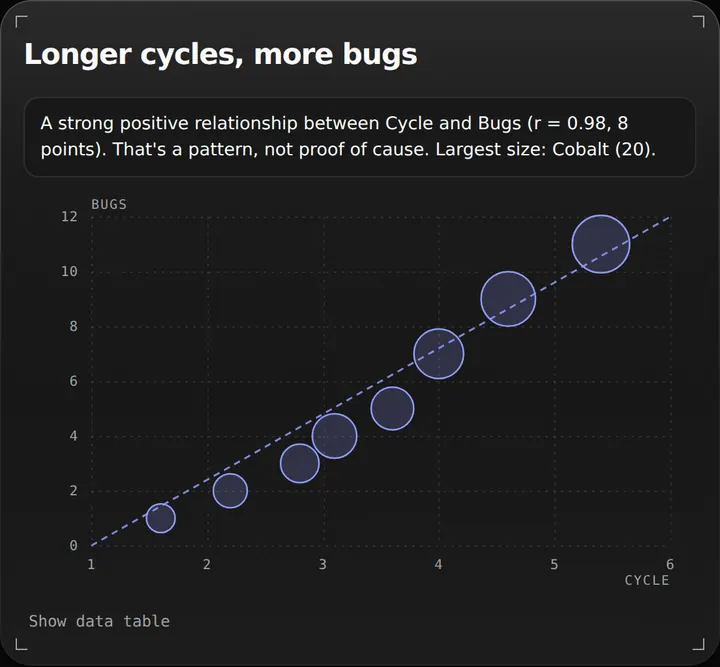
Scatter chart
FreeInstrumentPoints by two numbers, bubbles sized by area, groups, log axes, quadrants and trend lines; rows it can't place are counted
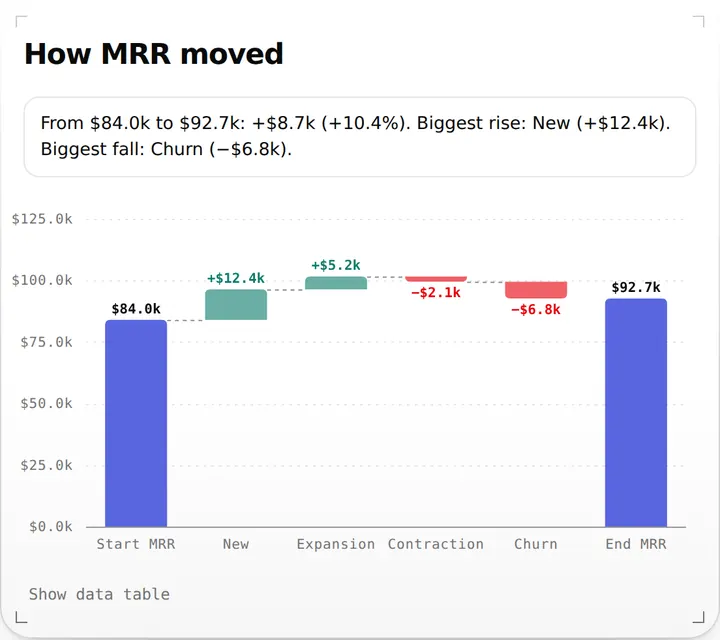
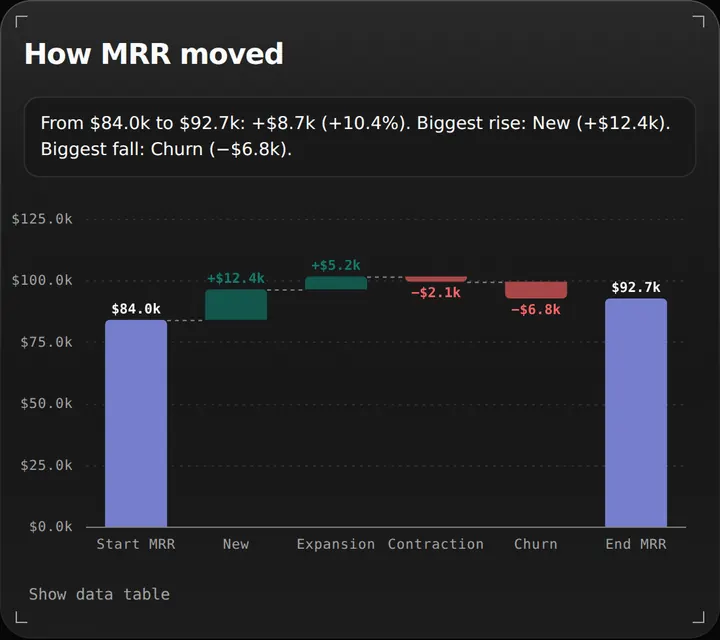
Waterfall chart
FreeInstrumentChanges step from level to level, totals re-anchor, rises and falls coloured by meaning, and a stated total that disagrees with the sum is flagged
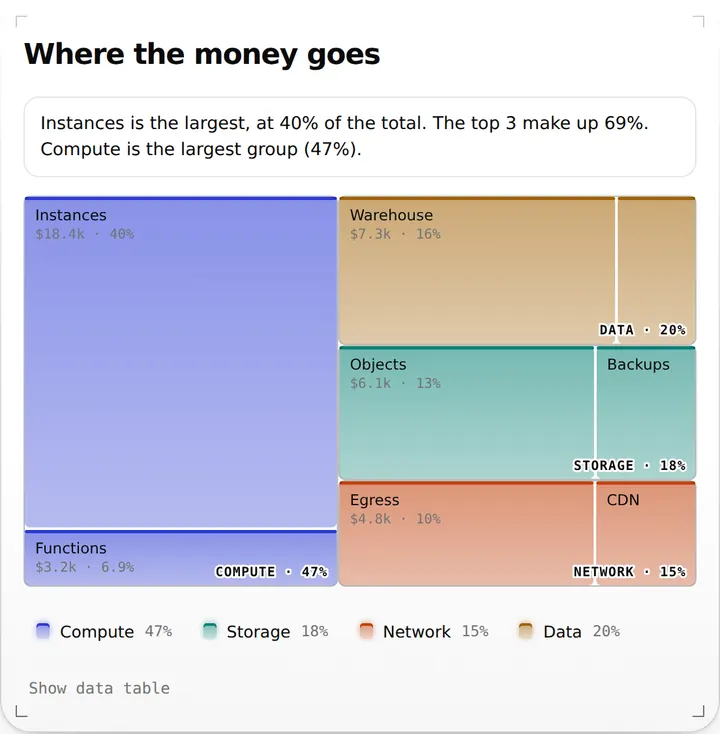
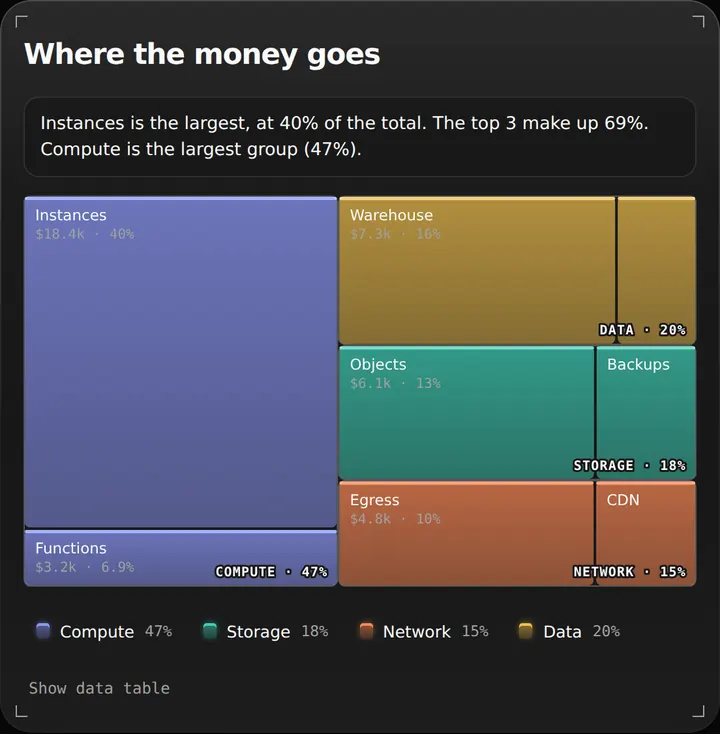
Treemap
FreeInstrumentAreas true to value, grouped one level, labels only where they fit; zero, negative and missing values are named instead of drawn
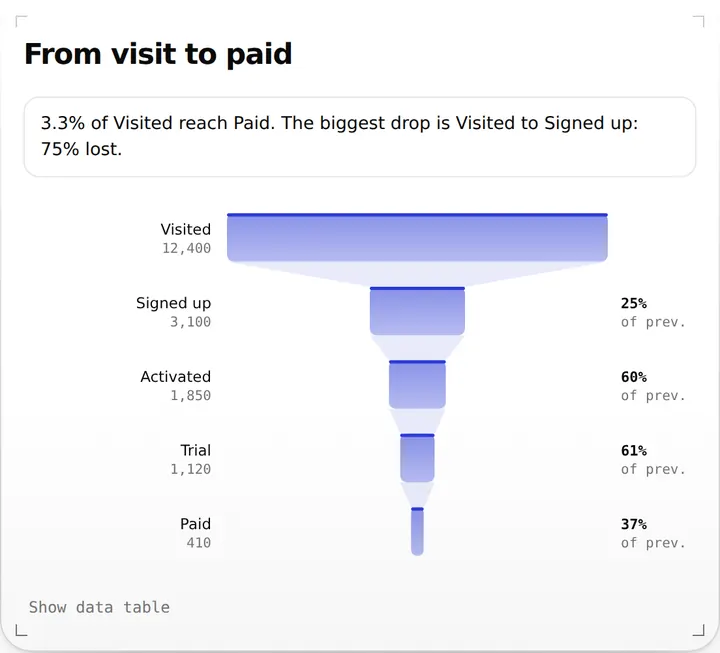
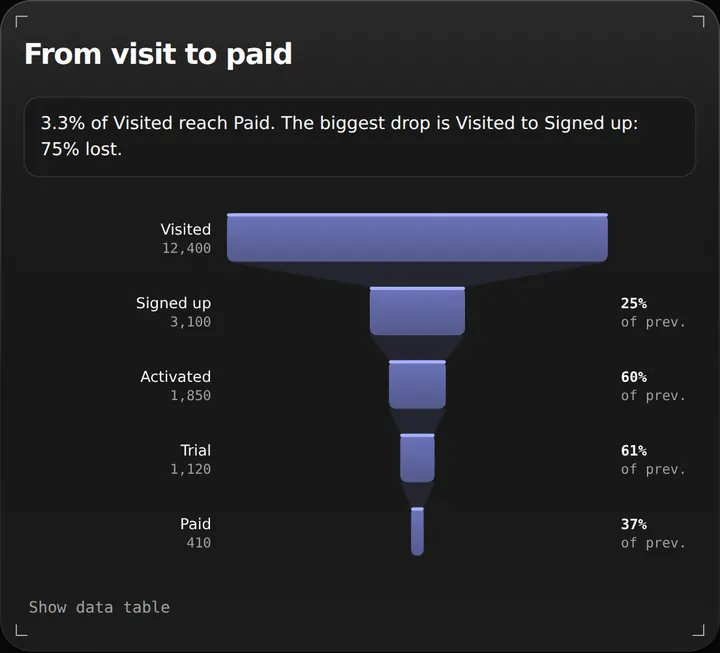
Funnel chart
FreeInstrumentSteps in order with the rate from the previous or first step, drop bands, and missing or rising steps named
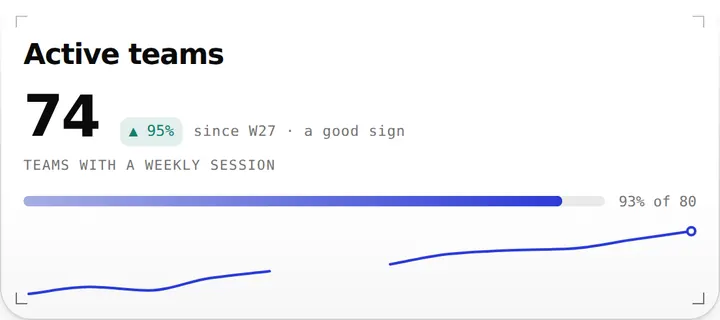
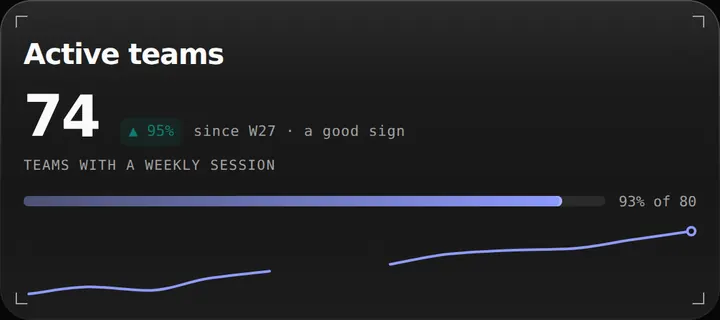
KPI stat
FreeInstrumentOne number with its change in words, an optional target meter and sparkline. Plain SVG: no chart engine
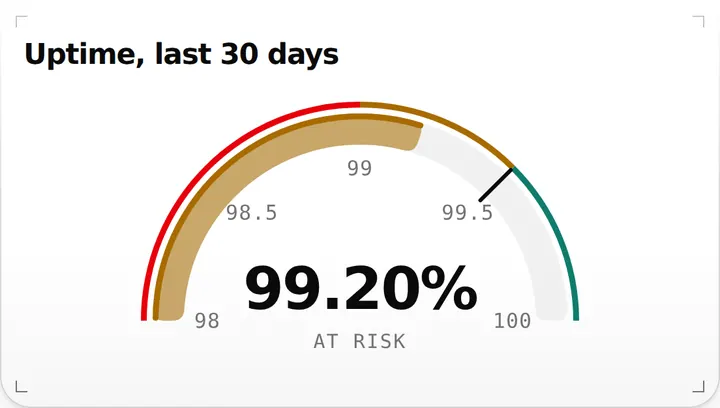
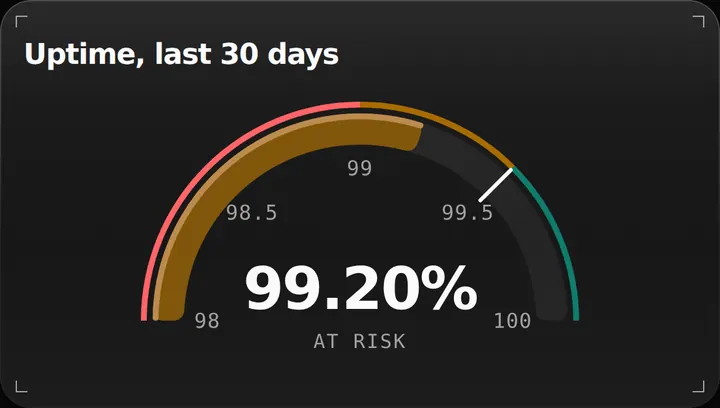
Gauge
FreeInstrumentA meter with bands, a target and honest out-of-range handling. Plain SVG: no chart engine
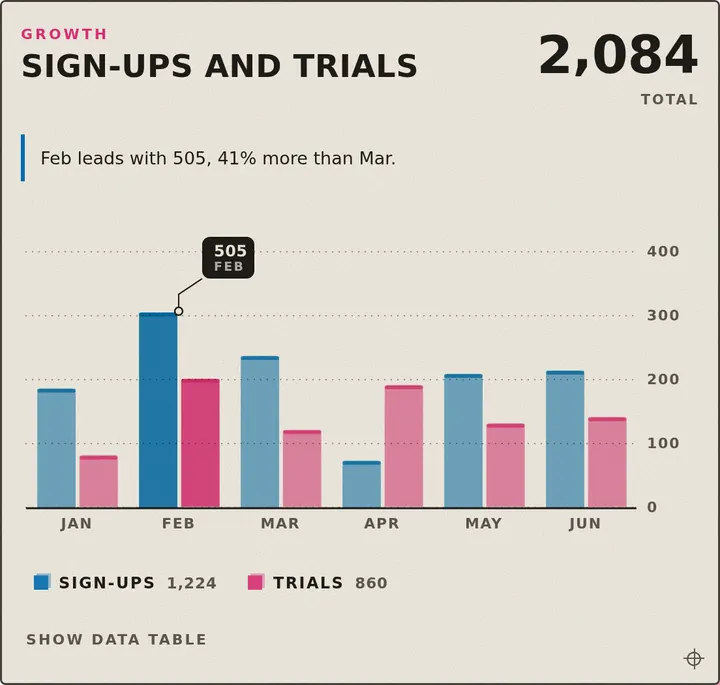
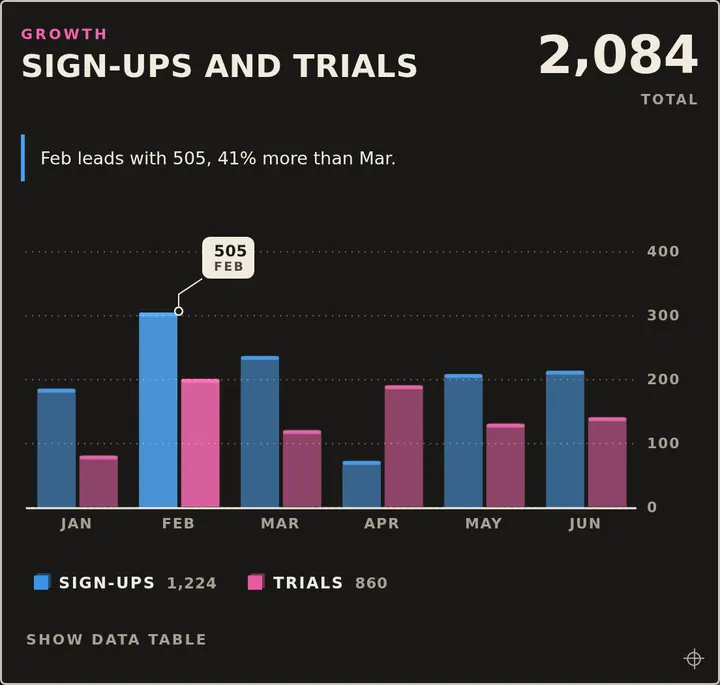
Bar chart
PaidRisoGrouped, stacked or 100%, vertical or horizontal, with a measured callout and a computed takeaway
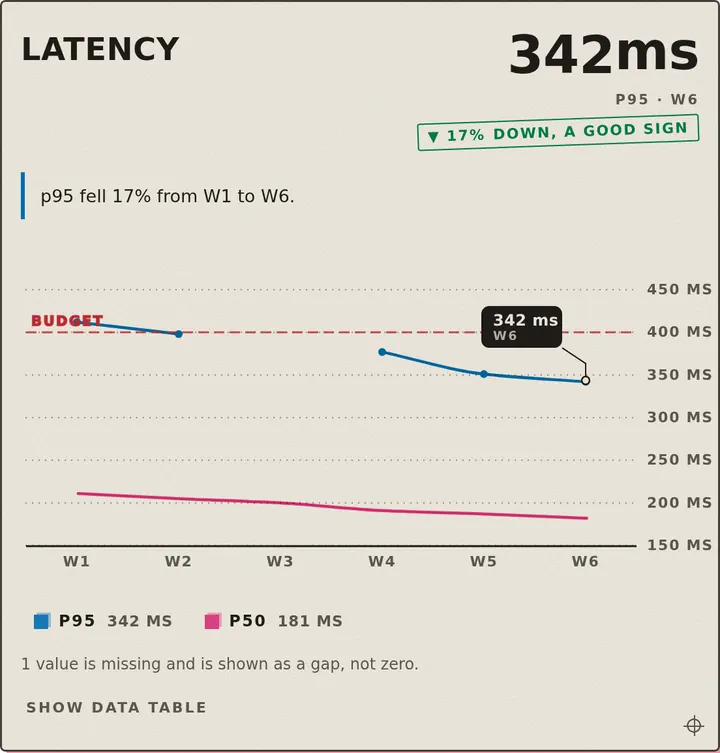
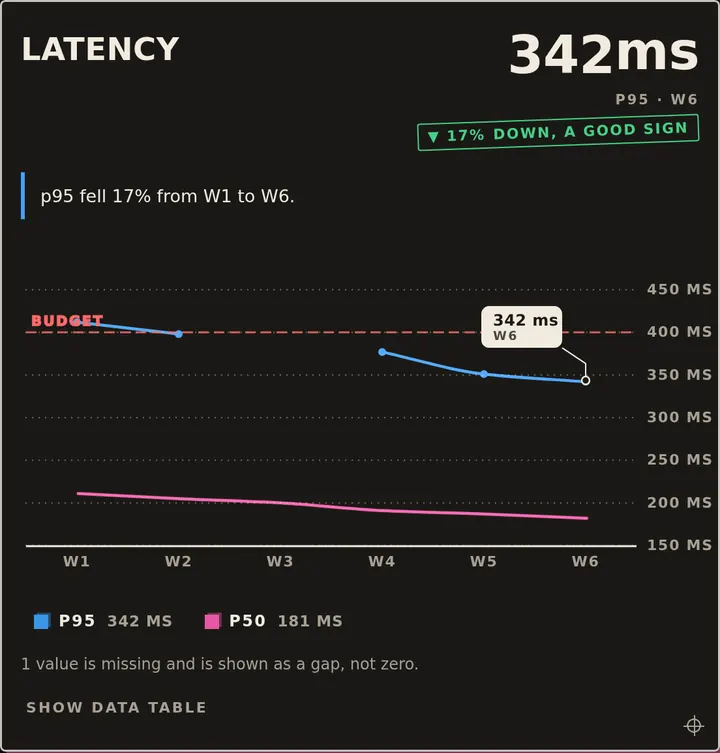
Line chart
PaidRisoTrends with honest gaps, forecast tails, references and a latest-value readout
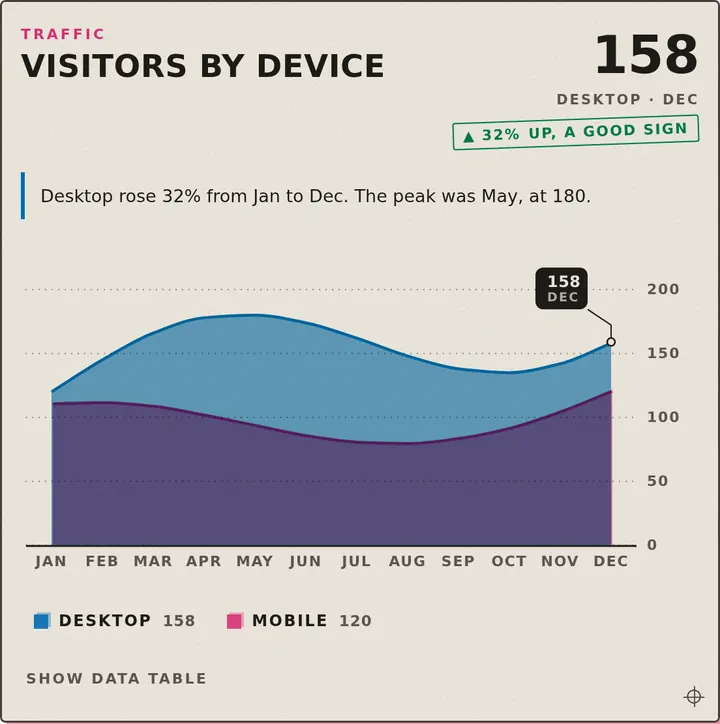
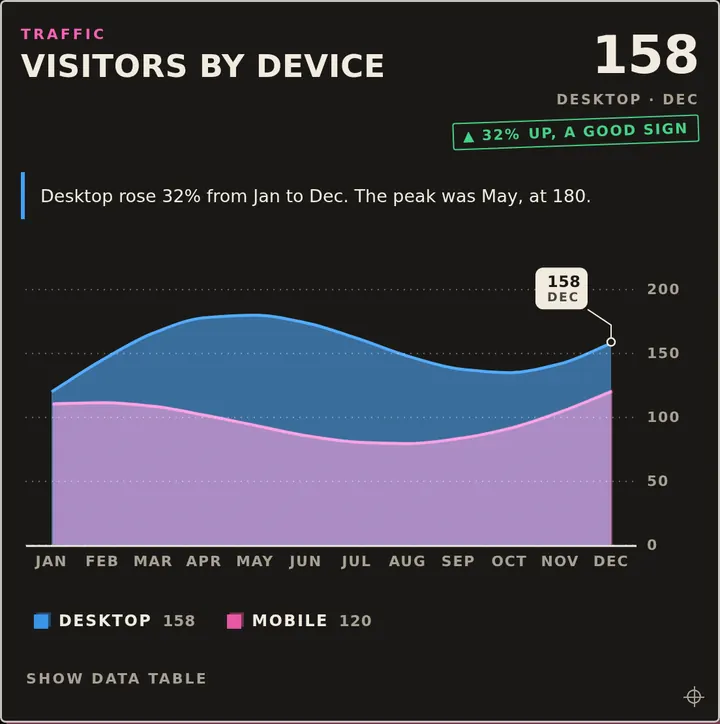
Area chart
FreeRisoOverlaid, stacked or 100% areas with gaps kept and forecast tails
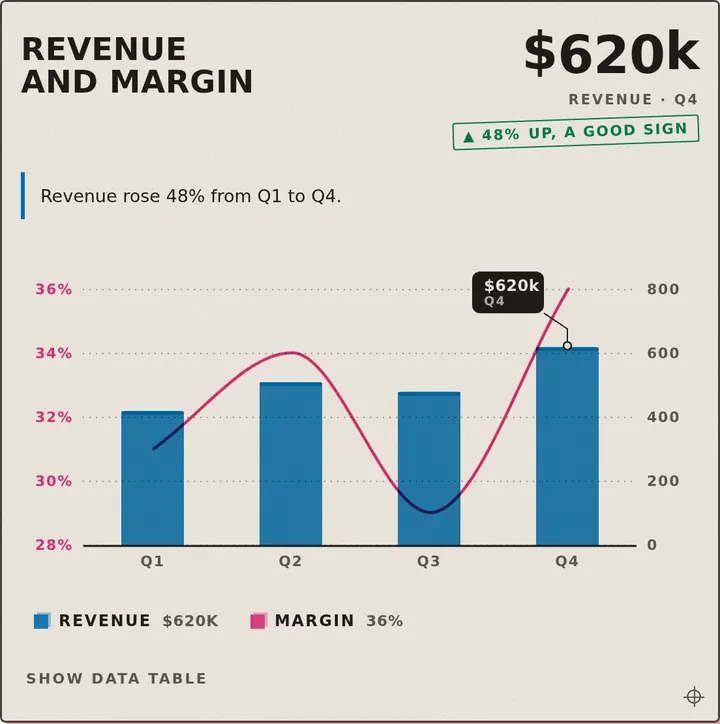
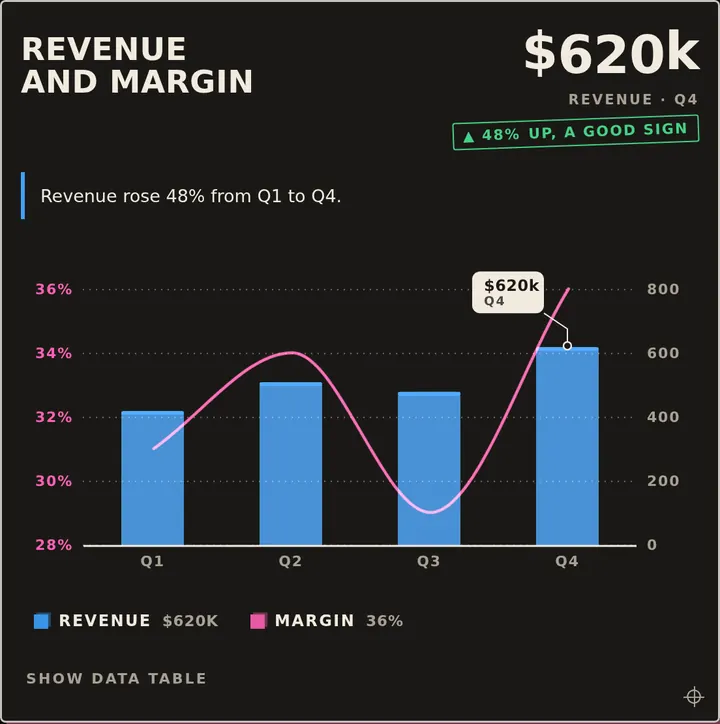
Composed chart
PaidRisoBars, lines and areas together, with a second value axis
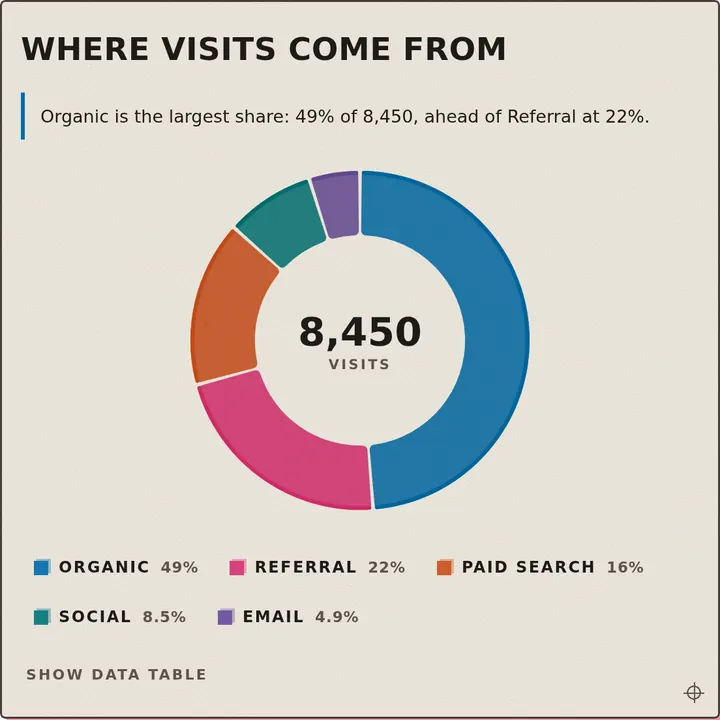
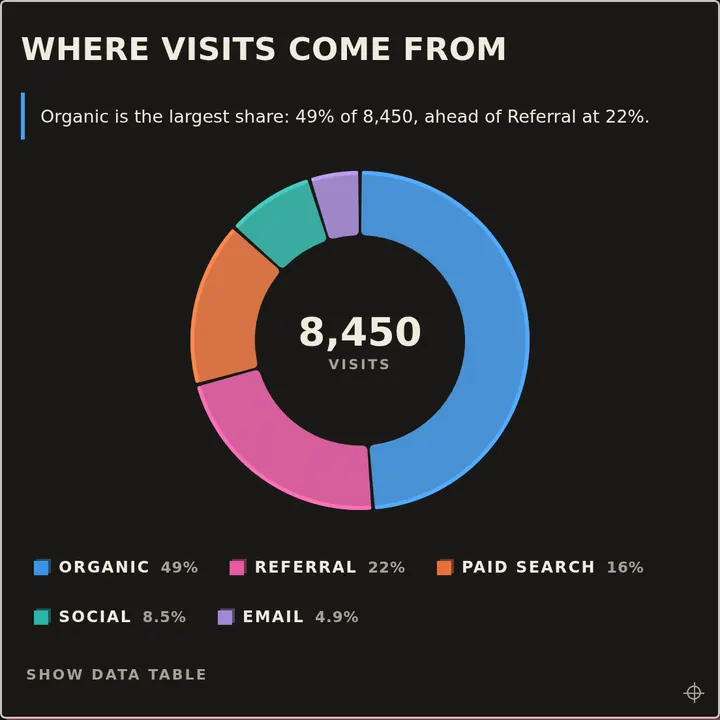
Donut chart
PaidRisoDonut or pie with Other grouping, honest exclusions, labels inside or outside and a centre readout
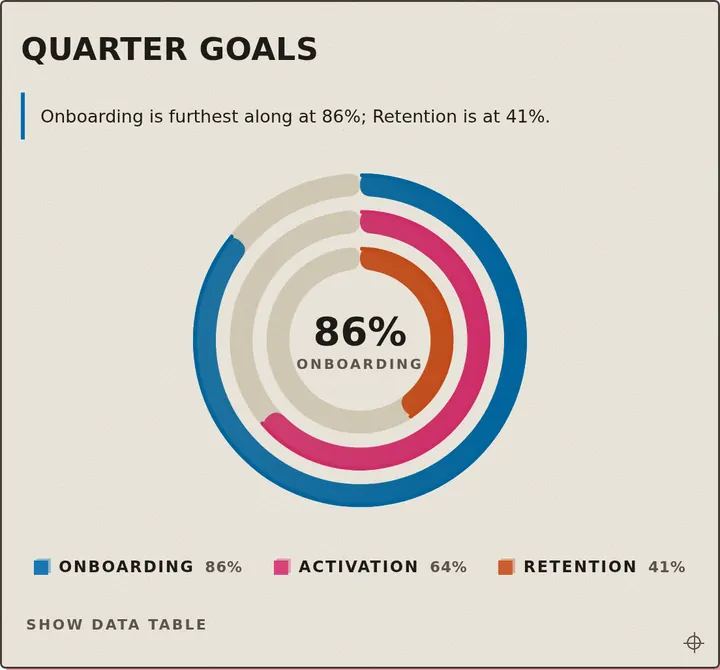
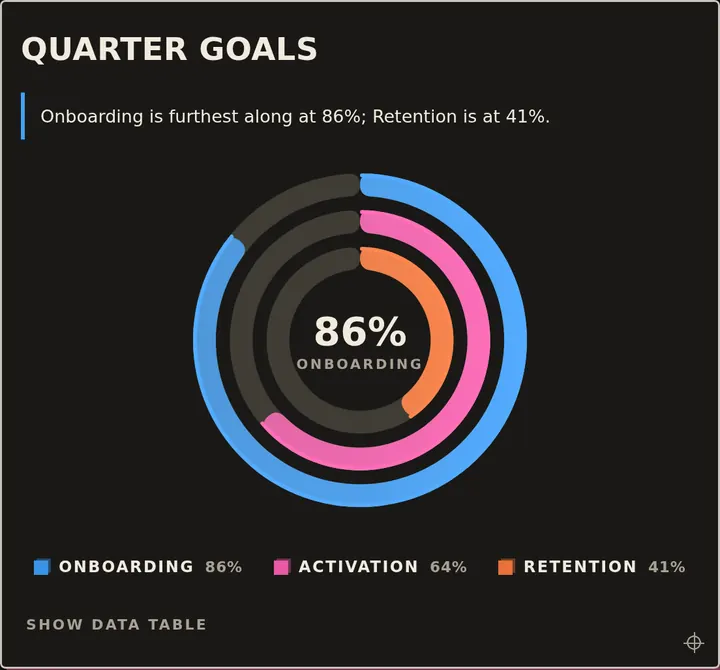
Radial chart
PaidRisoProgress rings, full or half, with goals and honest overflow
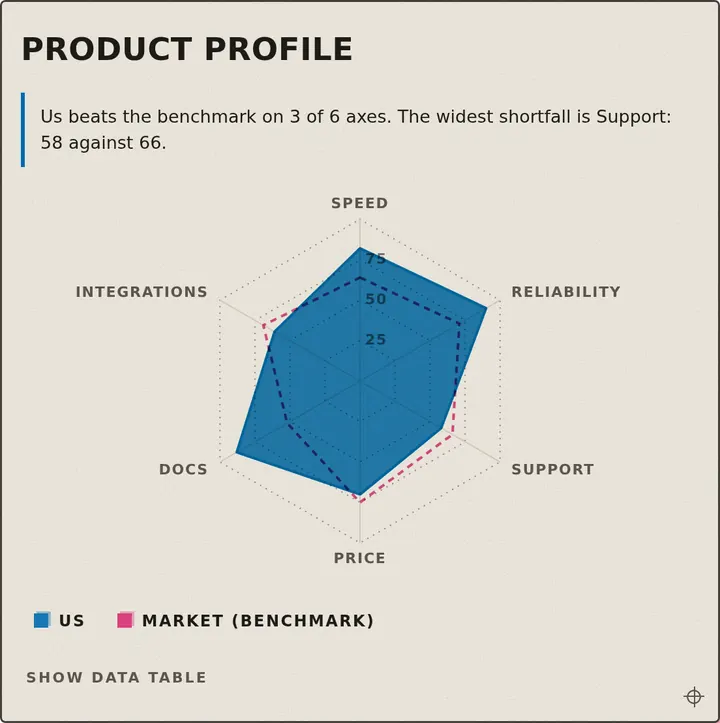
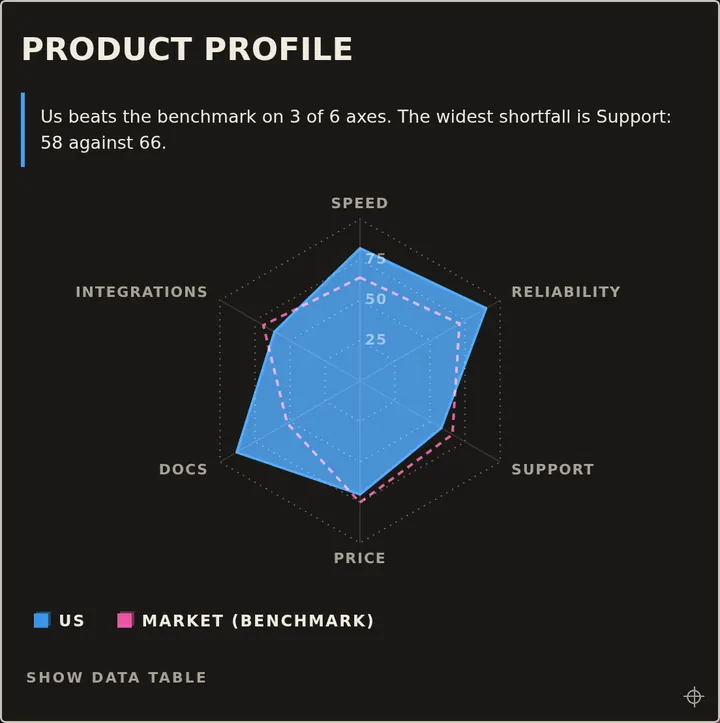
Radar chart
PaidRisoProfiles across axes with per-axis ranges, honest gaps and an optional benchmark
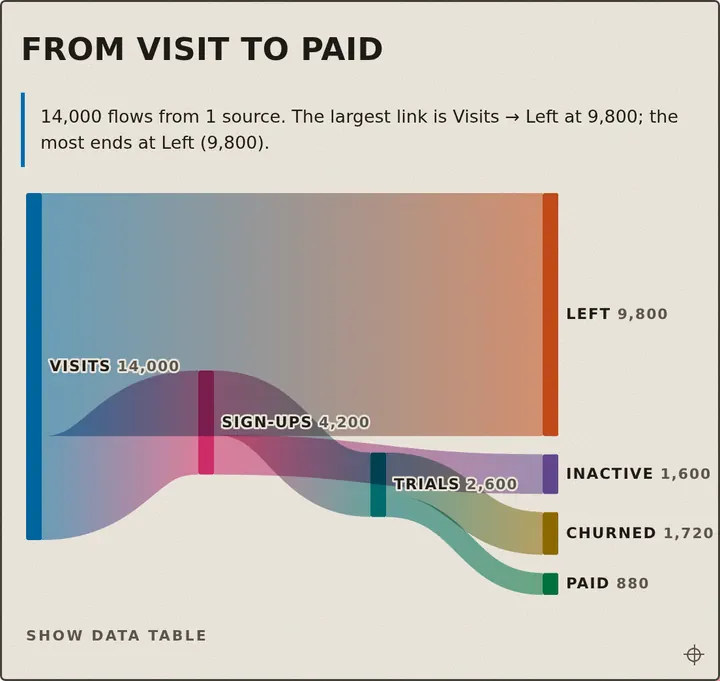
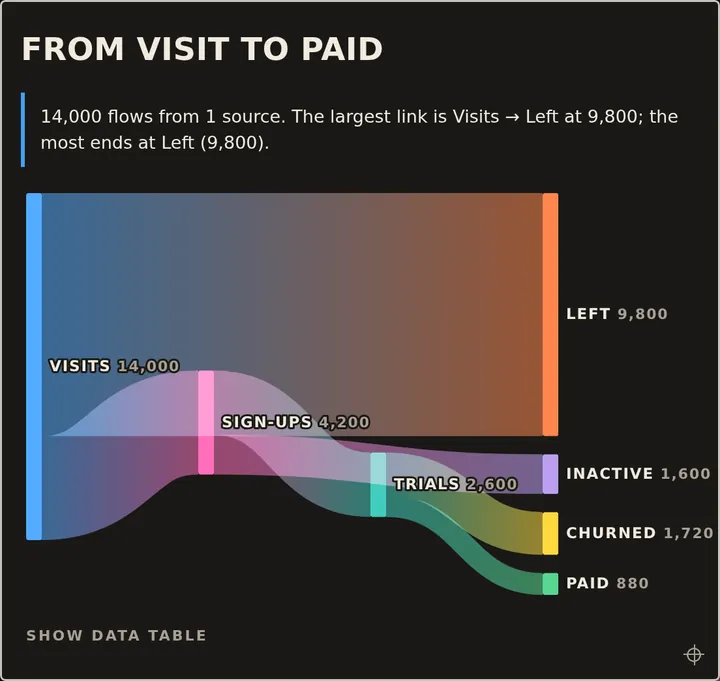
Sankey chart
PaidRisoFlows with validation, disclosures and path tracing. Same props and layout on both engines
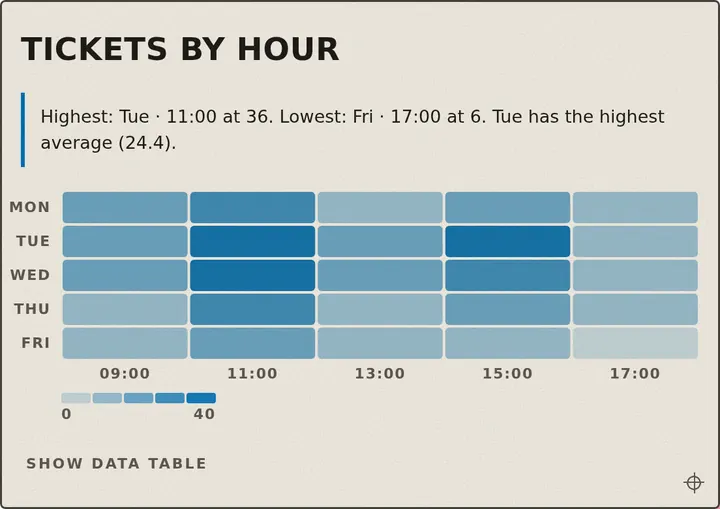
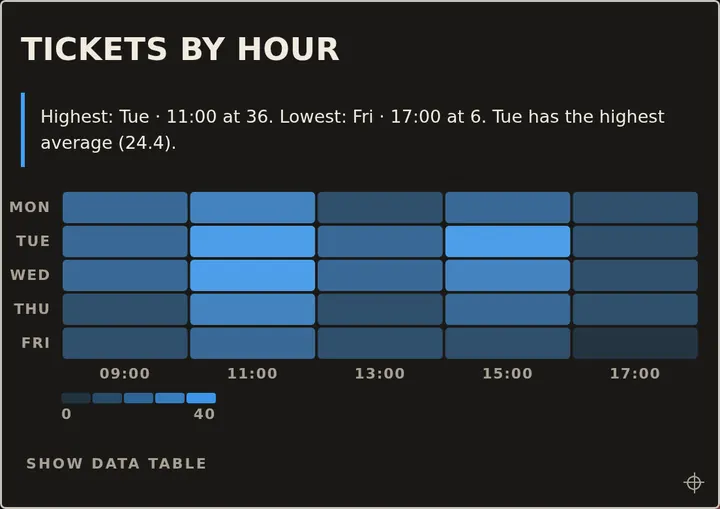
Heatmap
PaidRisoA matrix or calendar heatmap with a stepped or diverging scale and empty outlines for missing cells. Plain SVG: no chart engine
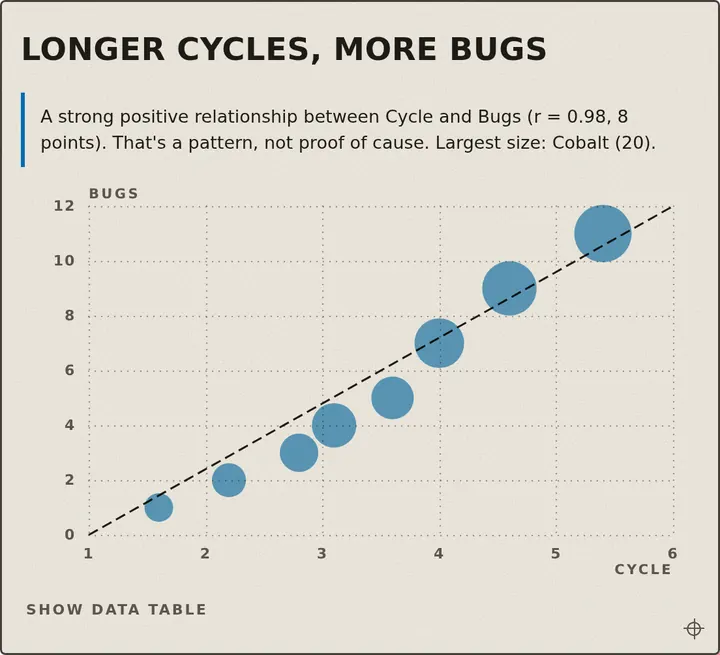
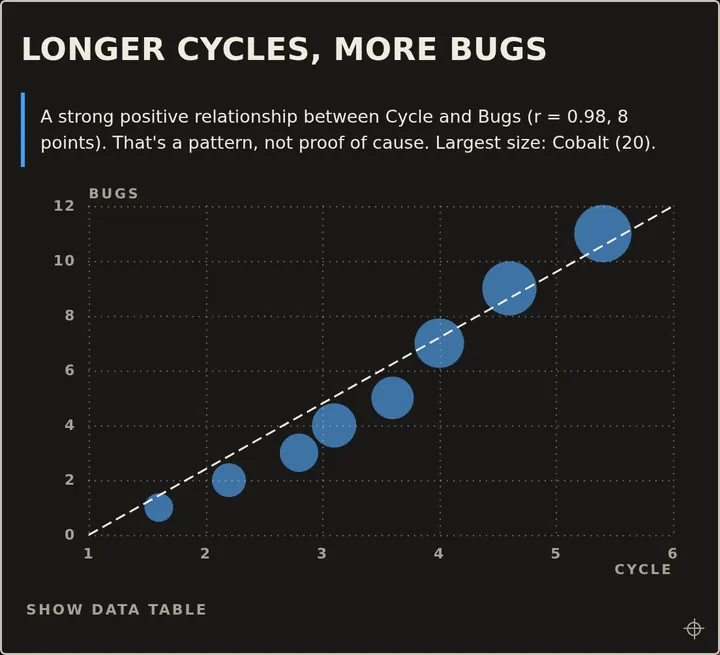
Scatter chart
PaidRisoPoints by two numbers, bubbles sized by area, groups, log axes, quadrants and trend lines; rows it can't place are counted
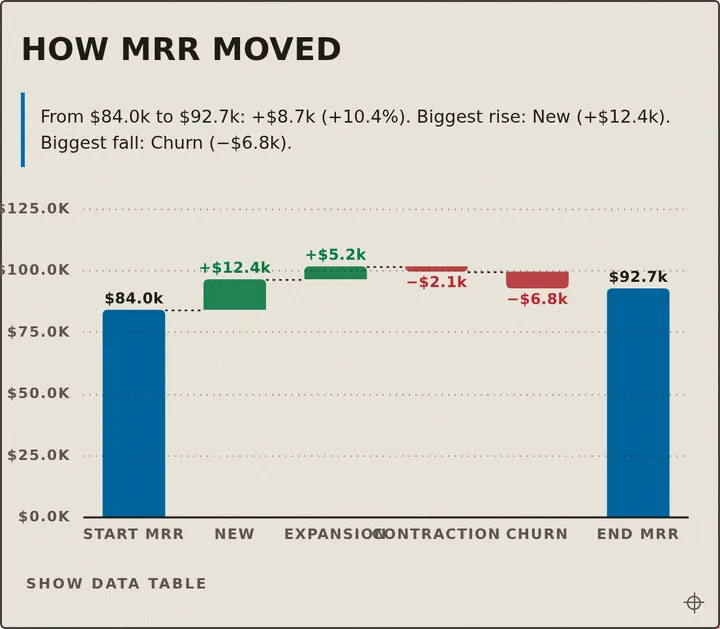
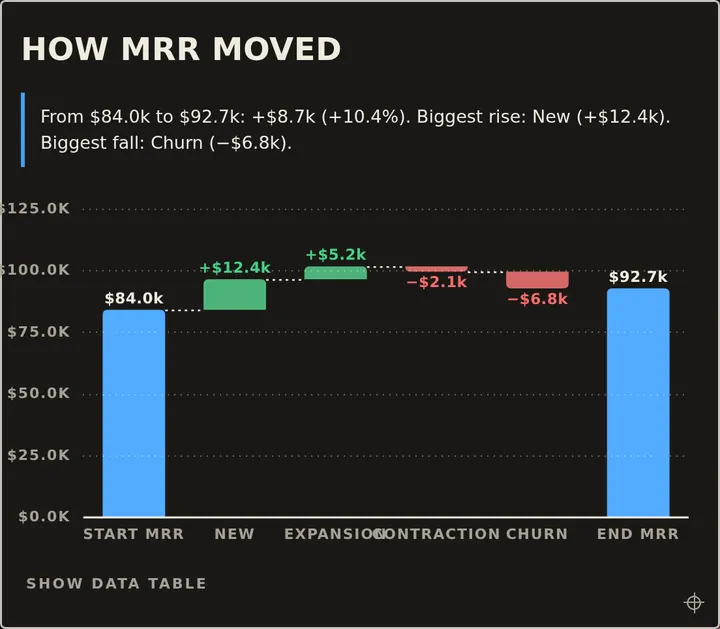
Waterfall chart
PaidRisoChanges step from level to level, totals re-anchor, rises and falls coloured by meaning, and a stated total that disagrees with the sum is flagged
Treemap
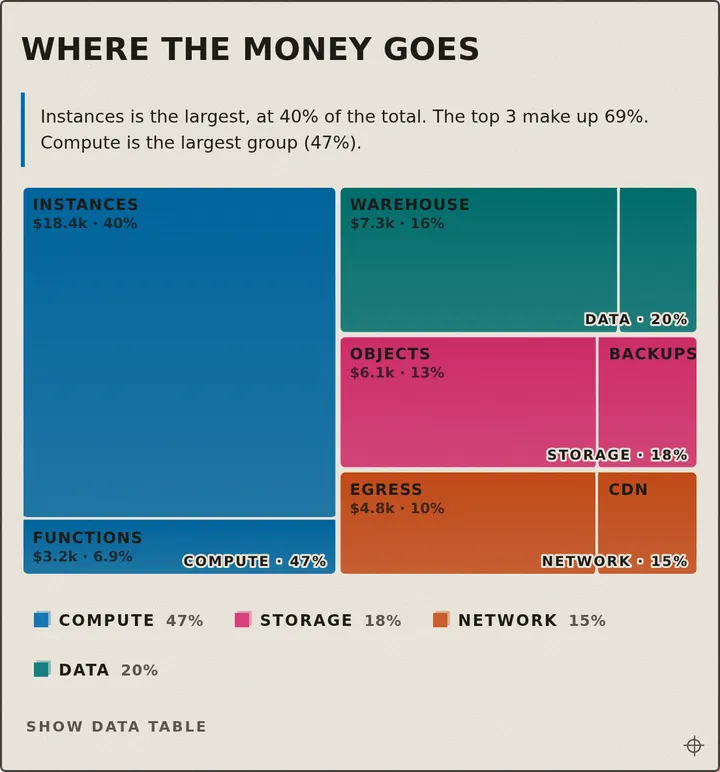
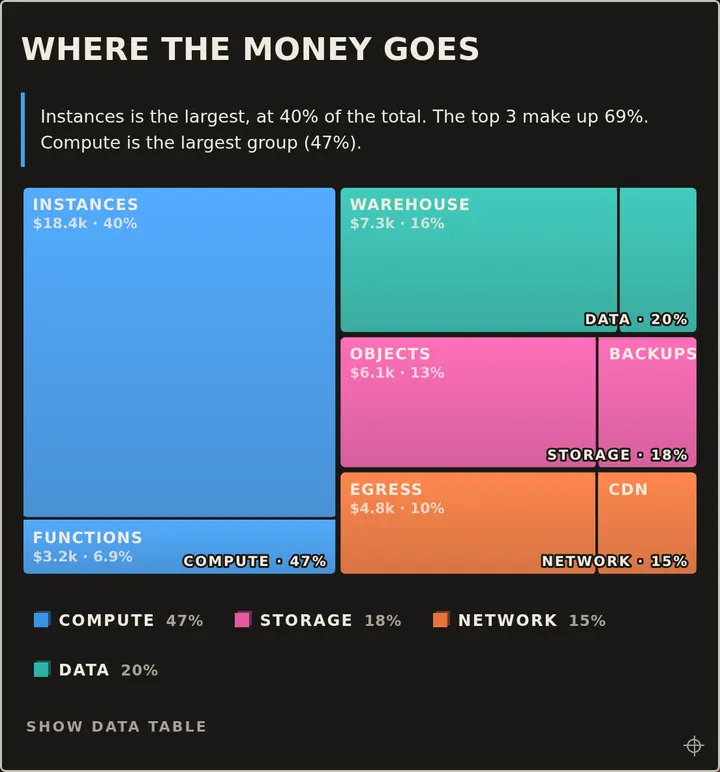
PaidRisoAreas true to value, grouped one level, labels only where they fit; zero, negative and missing values are named instead of drawn
Funnel chart
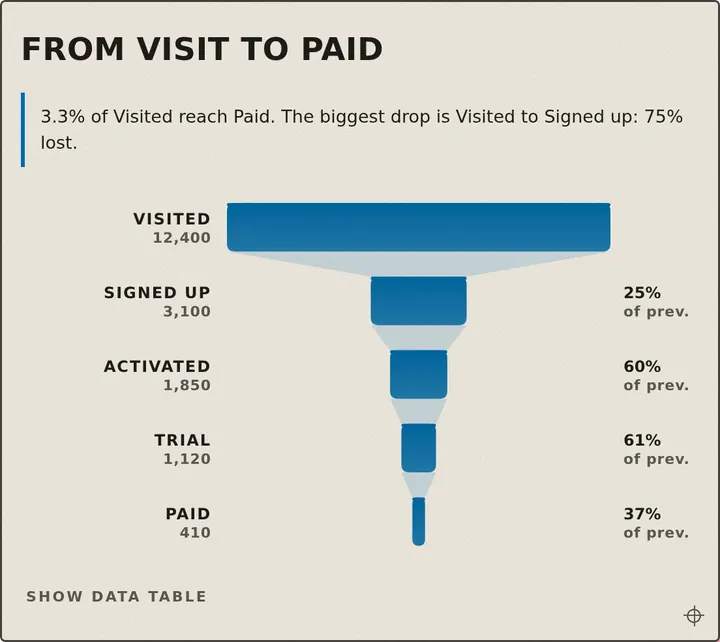
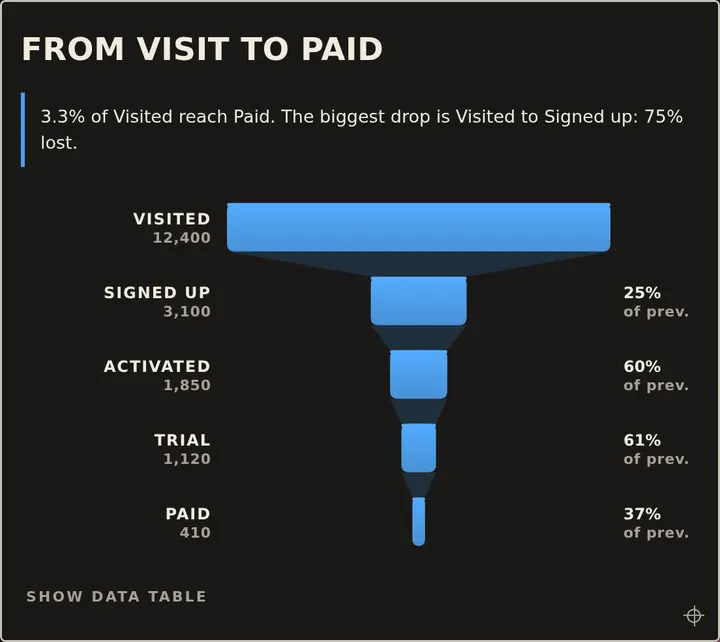
PaidRisoSteps in order with the rate from the previous or first step, drop bands, and missing or rising steps named
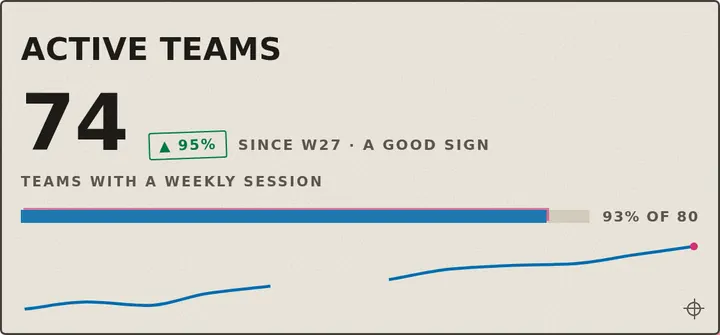
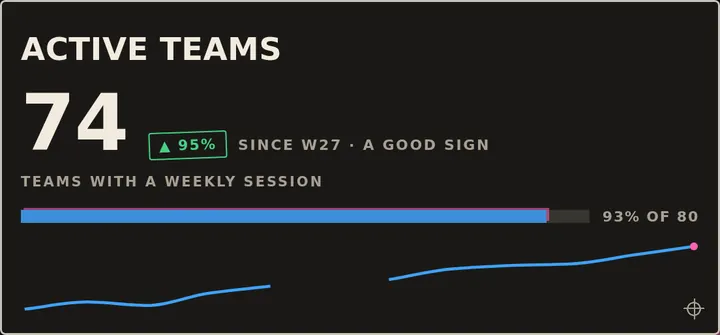
KPI stat
PaidRisoOne number with its change in words, an optional target meter and sparkline. Plain SVG: no chart engine
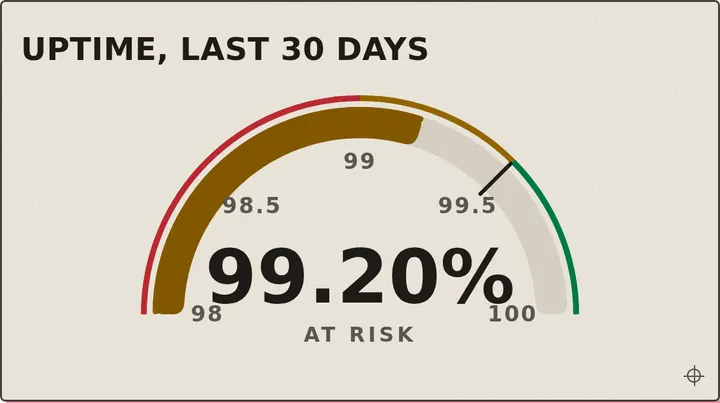
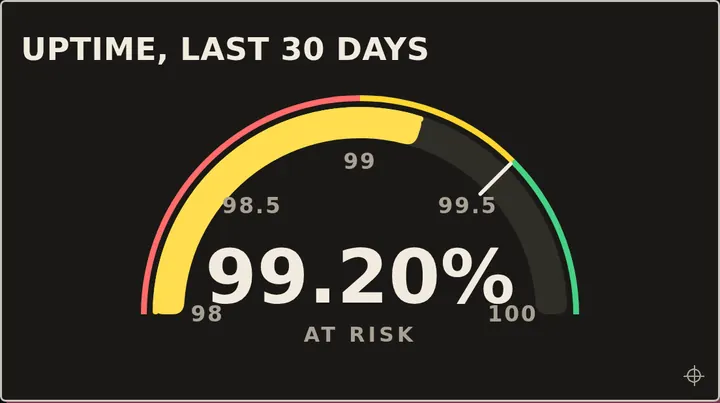
Gauge
PaidRisoA meter with bands, a target and honest out-of-range handling. Plain SVG: no chart engine
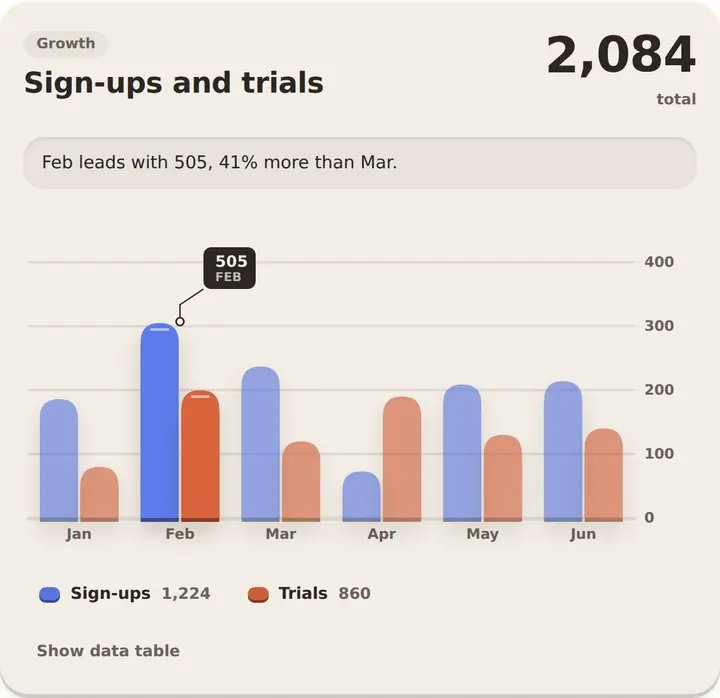
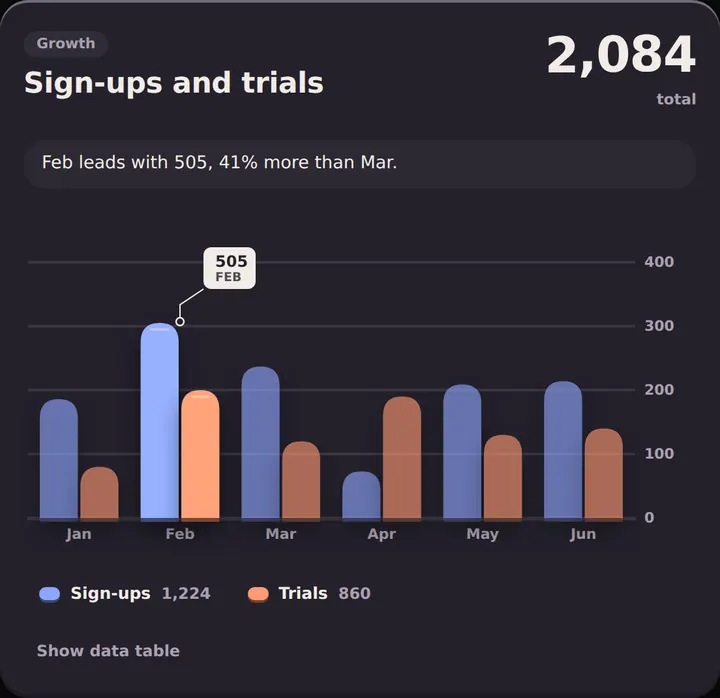
Bar chart
FreeClayGrouped, stacked or 100%, vertical or horizontal, with a measured callout and a computed takeaway
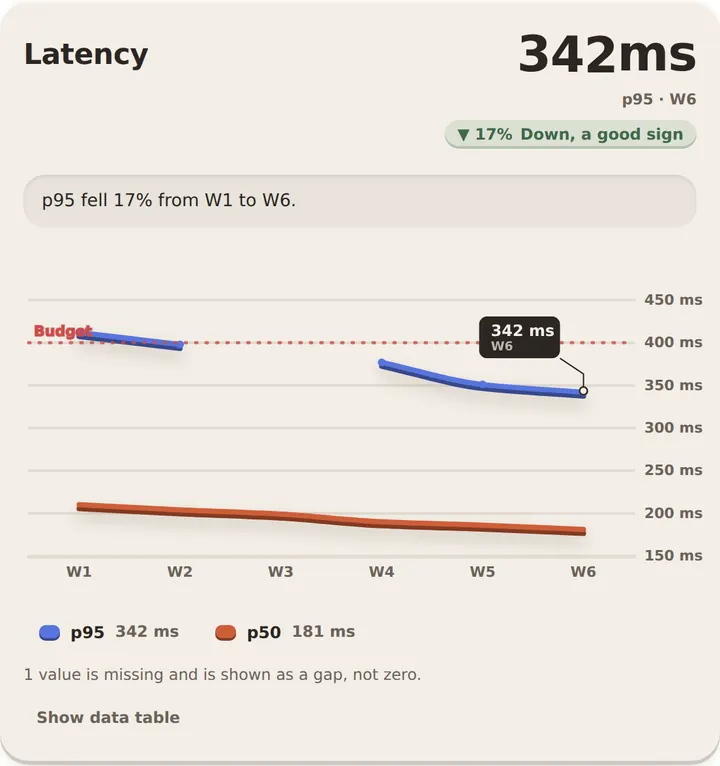
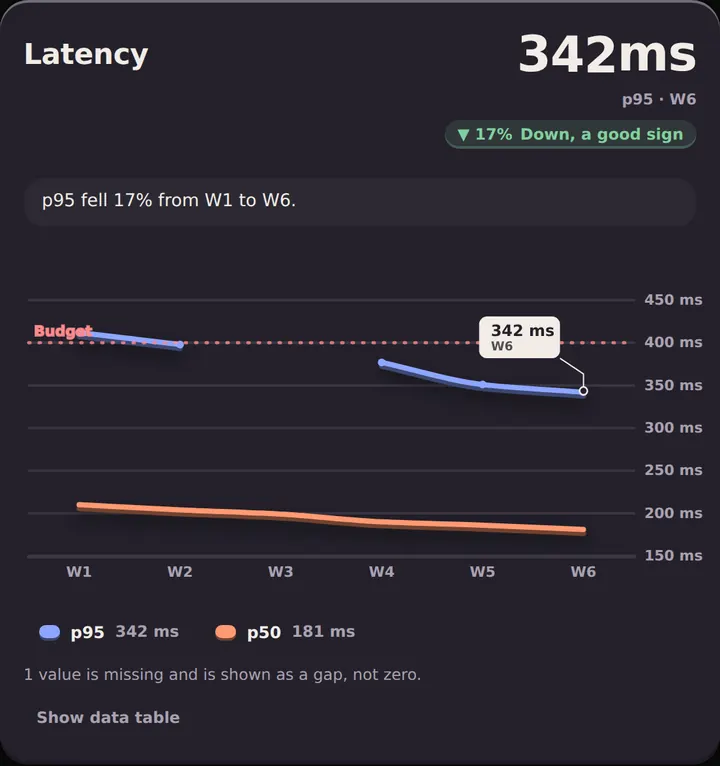
Line chart
PaidClayTrends with honest gaps, forecast tails, references and a latest-value readout
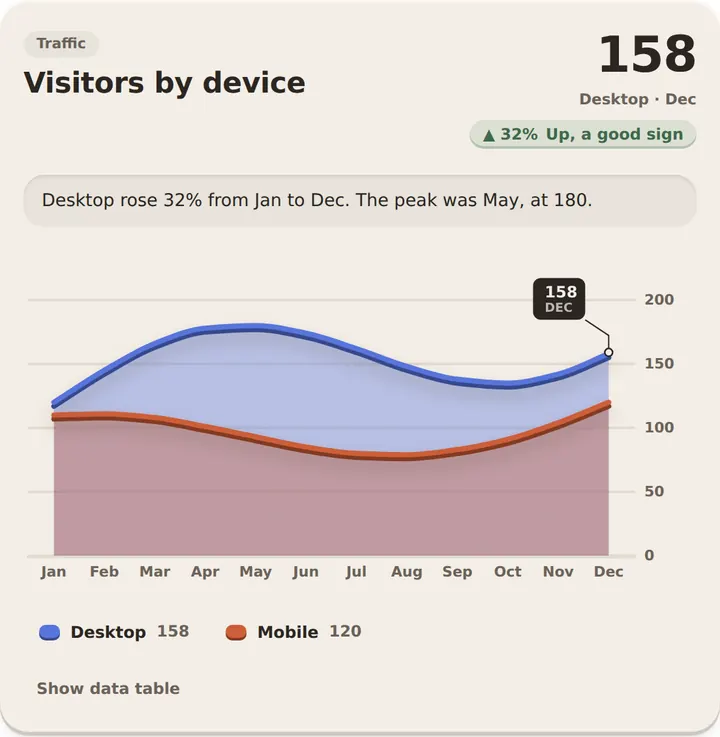
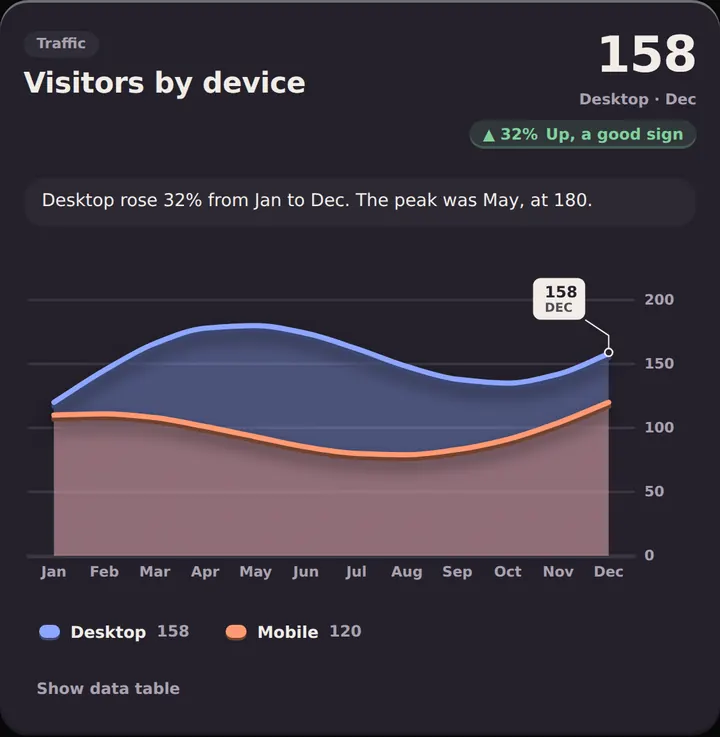
Area chart
PaidClayOverlaid, stacked or 100% areas with gaps kept and forecast tails
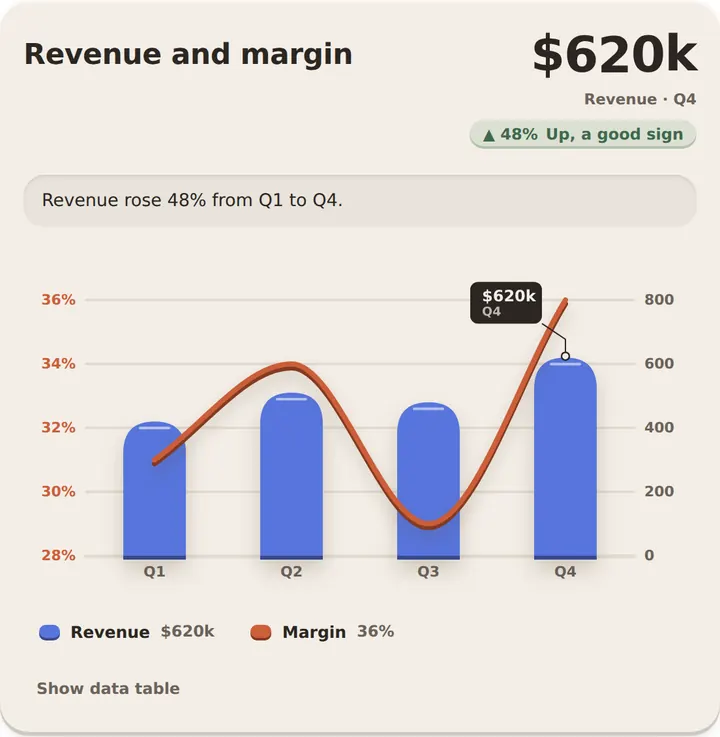
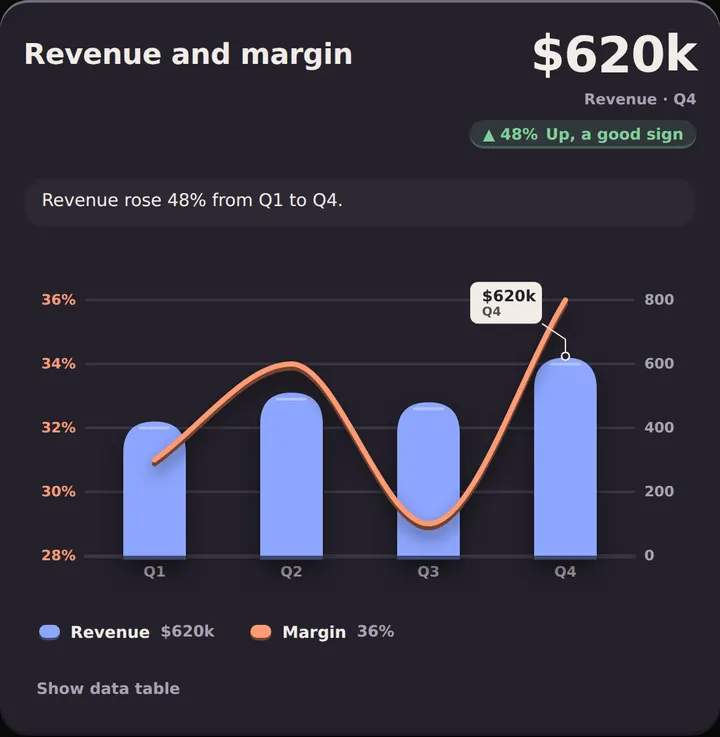
Composed chart
PaidClayBars, lines and areas together, with a second value axis
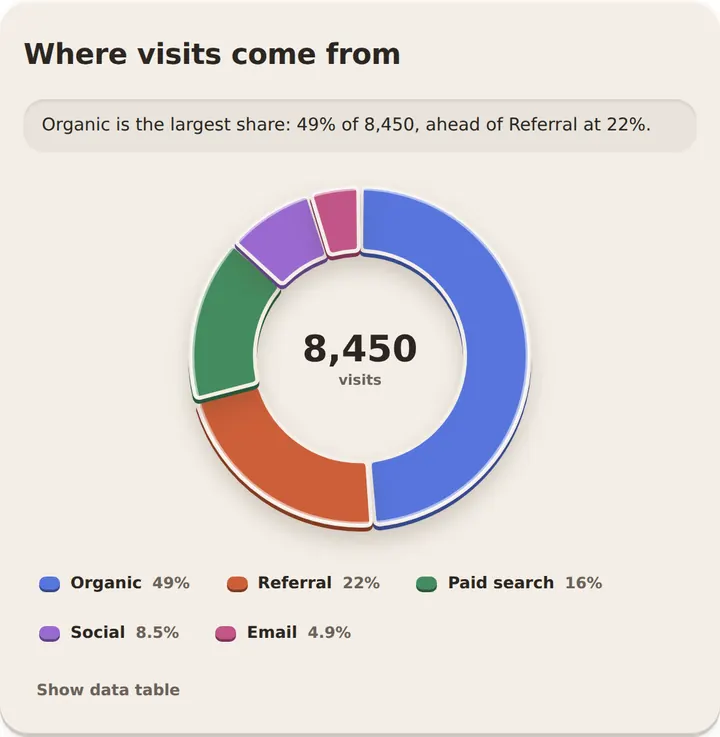
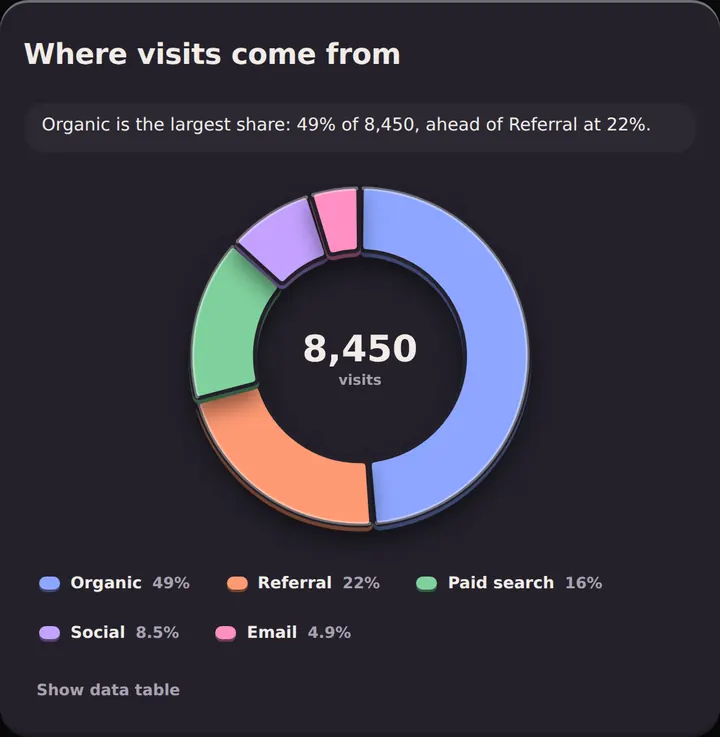
Donut chart
PaidClayDonut or pie with Other grouping, honest exclusions, labels inside or outside and a centre readout
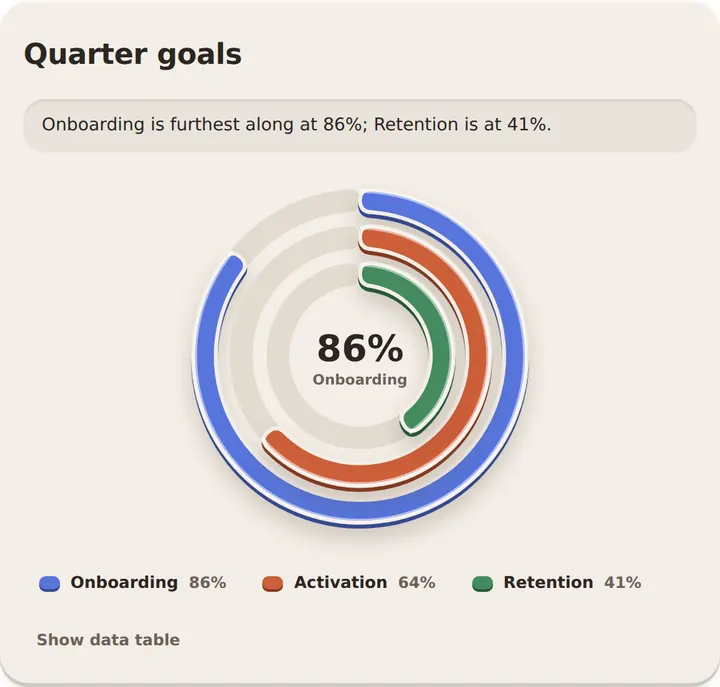
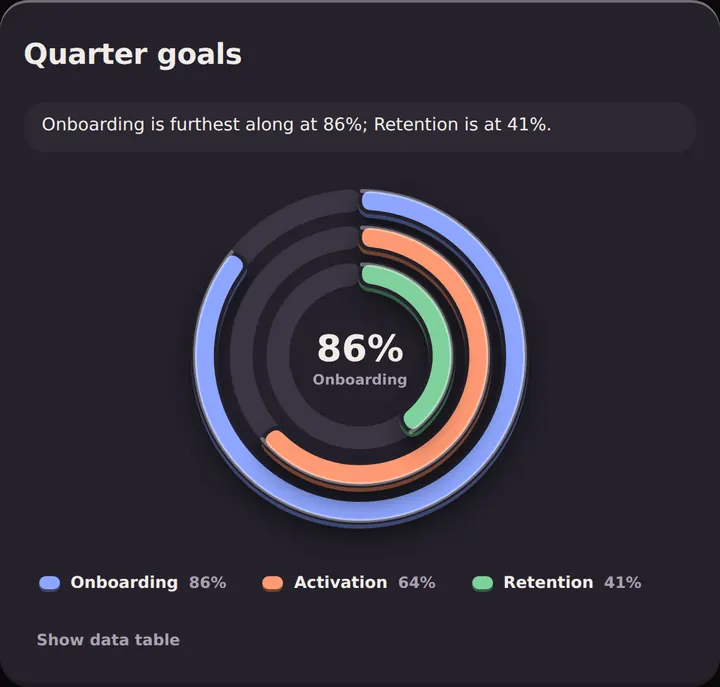
Radial chart
PaidClayProgress rings, full or half, with goals and honest overflow
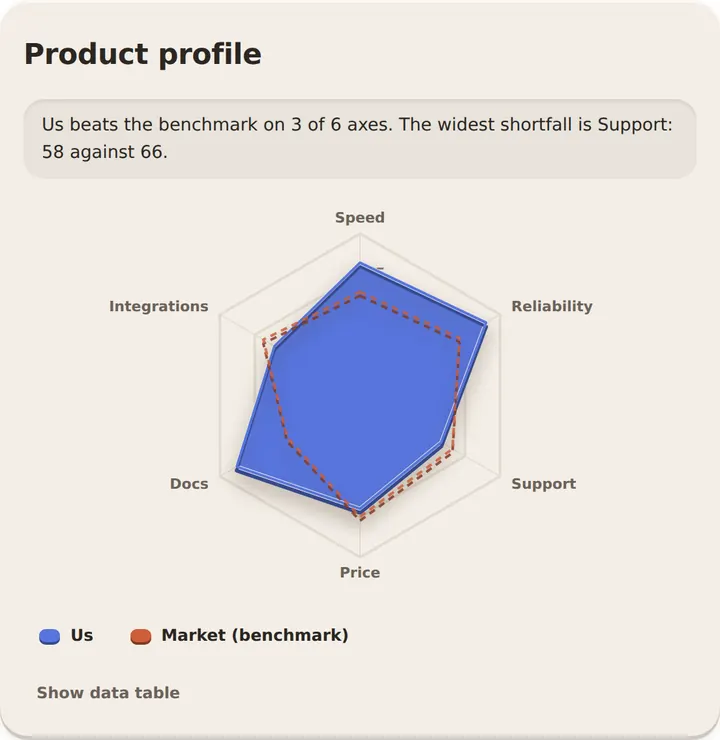
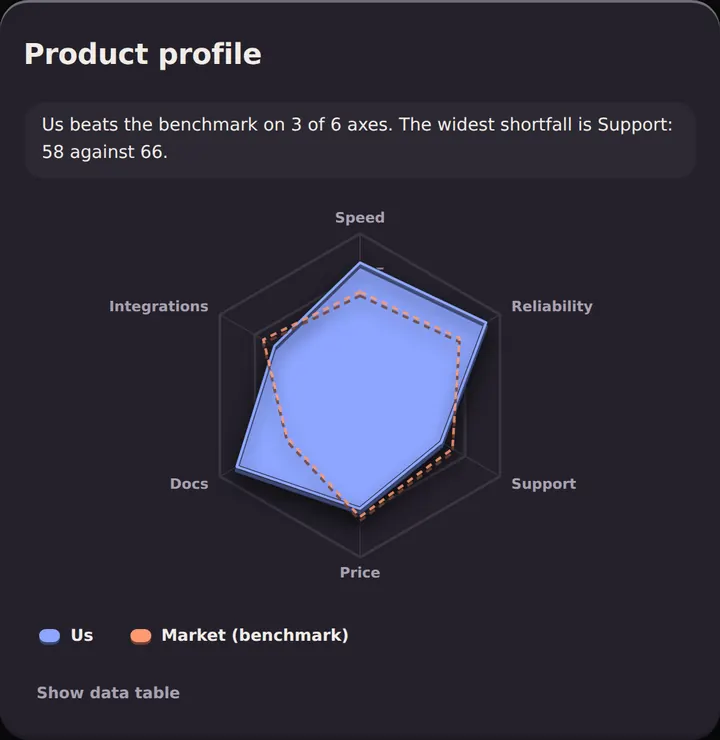
Radar chart
PaidClayProfiles across axes with per-axis ranges, honest gaps and an optional benchmark
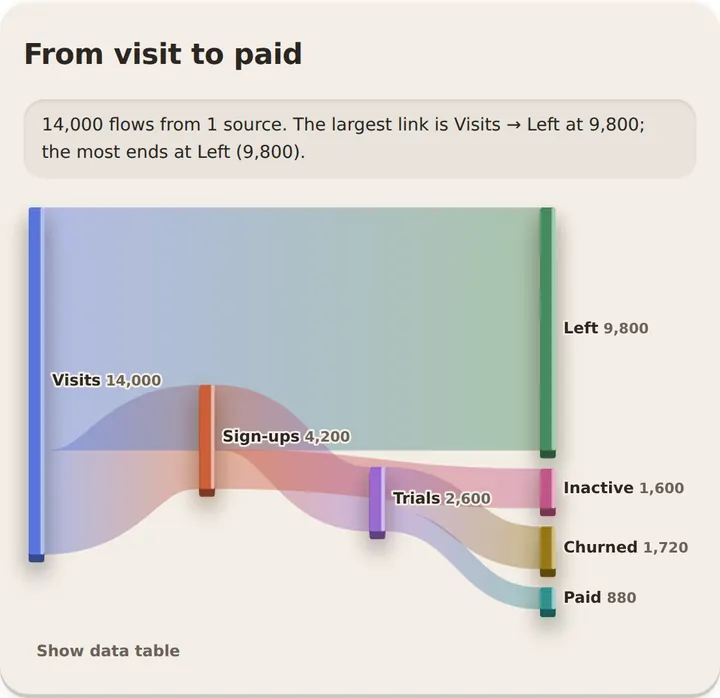
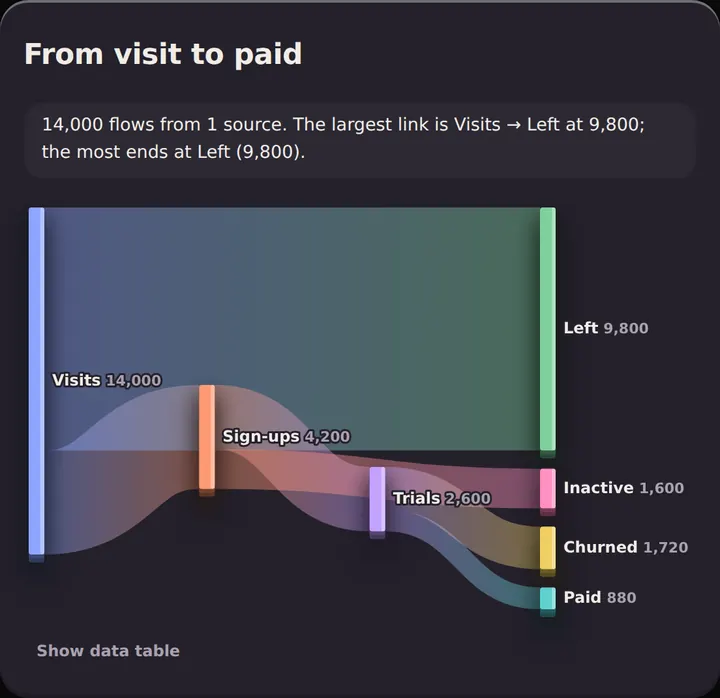
Sankey chart
PaidClayFlows with validation, disclosures and path tracing. Same props and layout on both engines
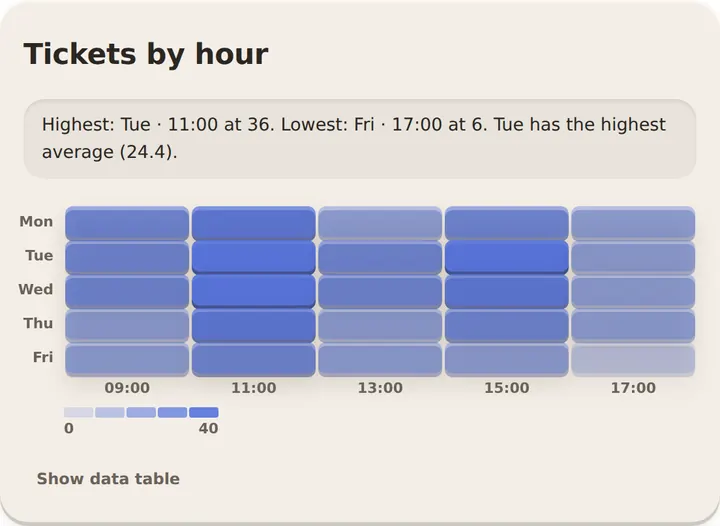
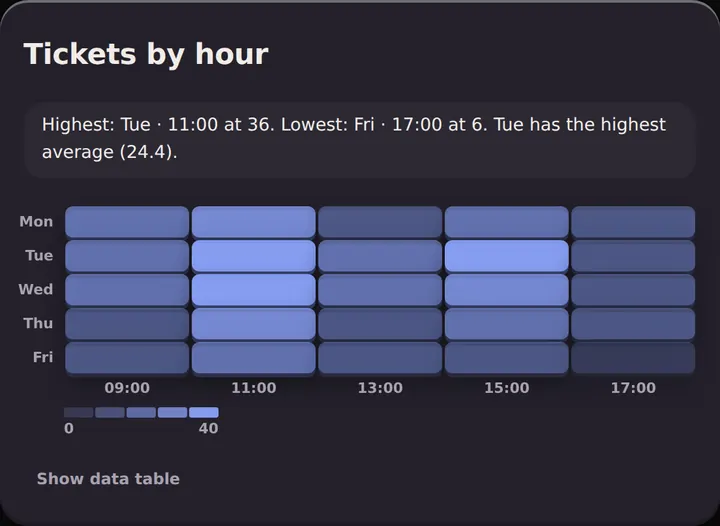
Heatmap
PaidClayA matrix or calendar heatmap with a stepped or diverging scale and empty outlines for missing cells. Plain SVG: no chart engine
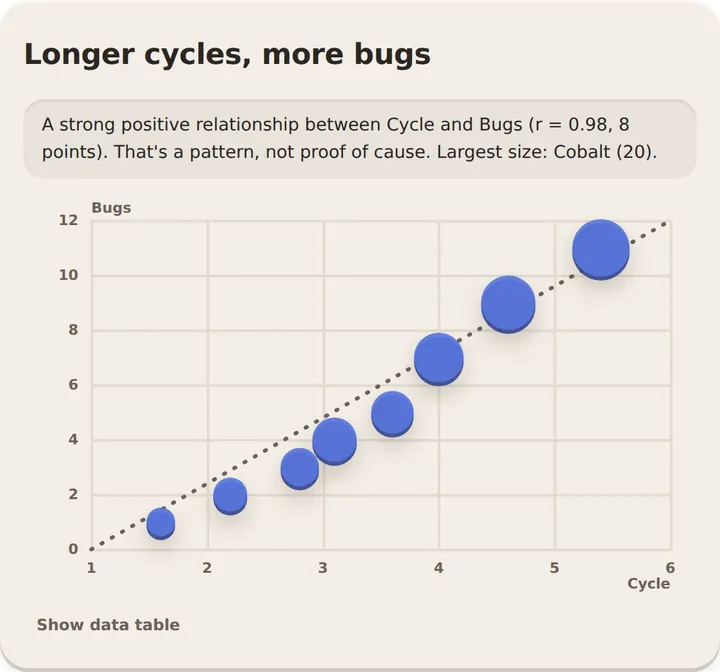
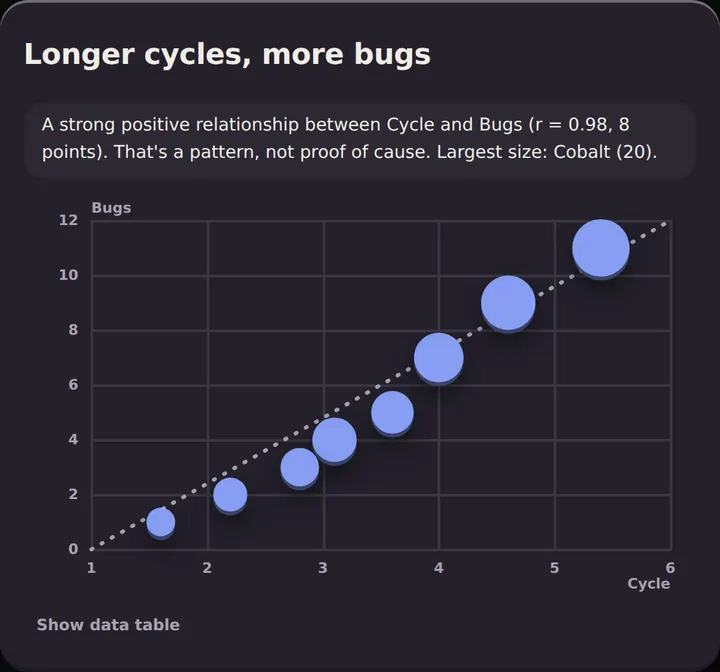
Scatter chart
PaidClayPoints by two numbers, bubbles sized by area, groups, log axes, quadrants and trend lines; rows it can't place are counted
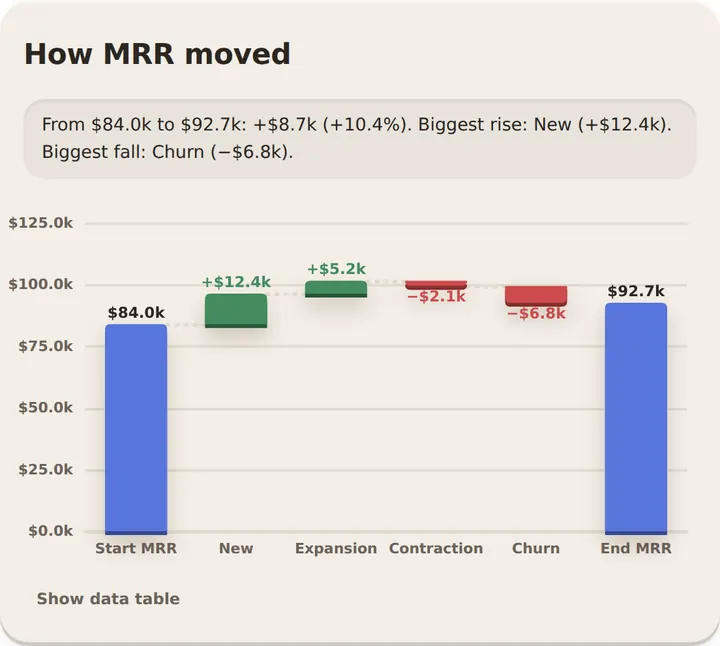
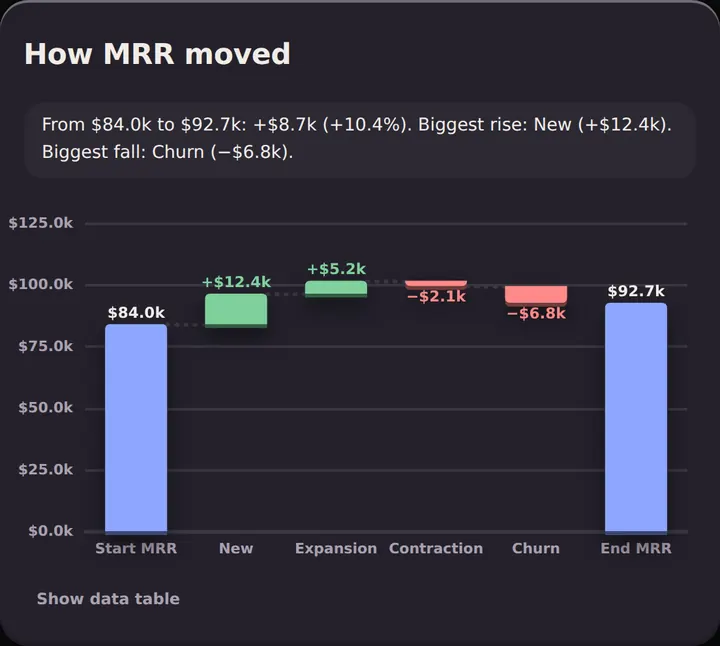
Waterfall chart
PaidClayChanges step from level to level, totals re-anchor, rises and falls coloured by meaning, and a stated total that disagrees with the sum is flagged
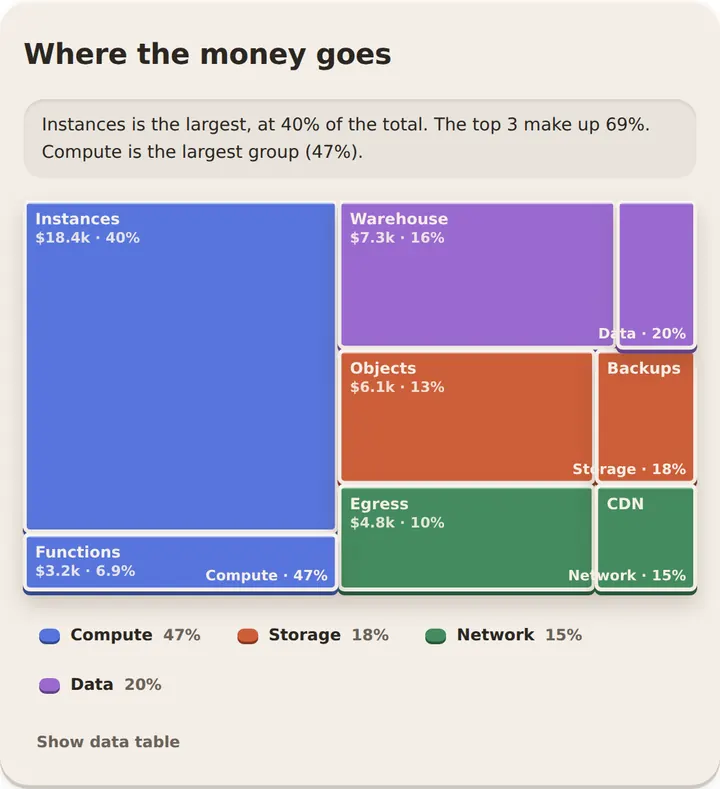
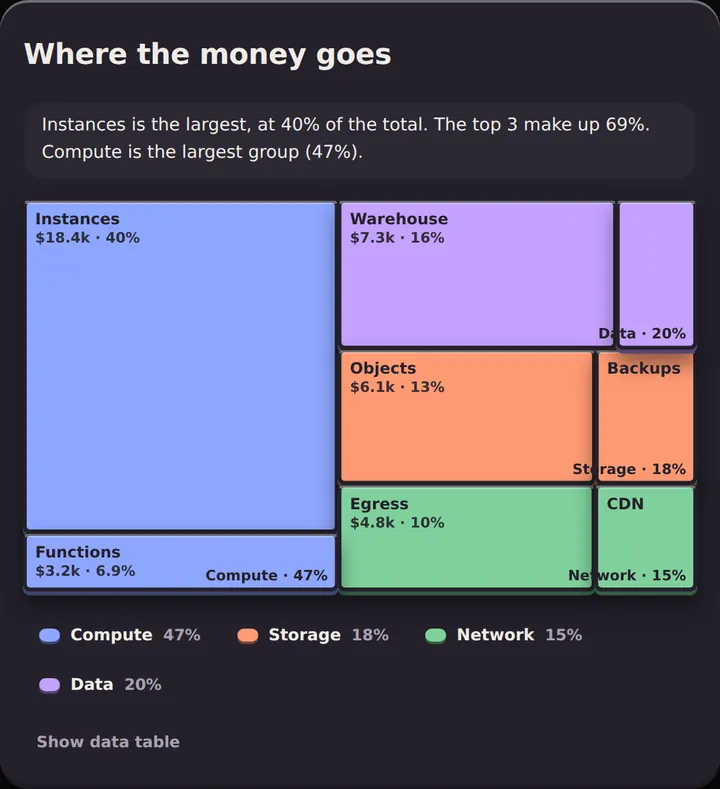
Treemap
PaidClayAreas true to value, grouped one level, labels only where they fit; zero, negative and missing values are named instead of drawn
Funnel chart
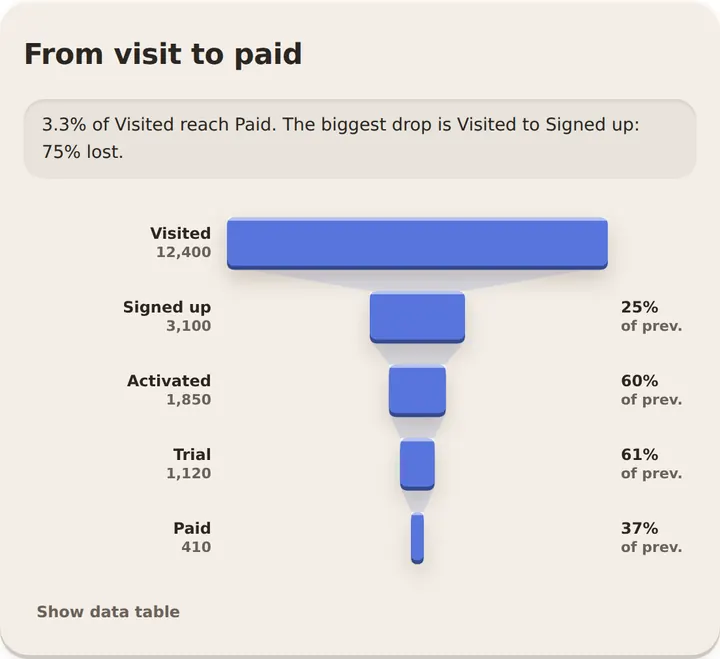
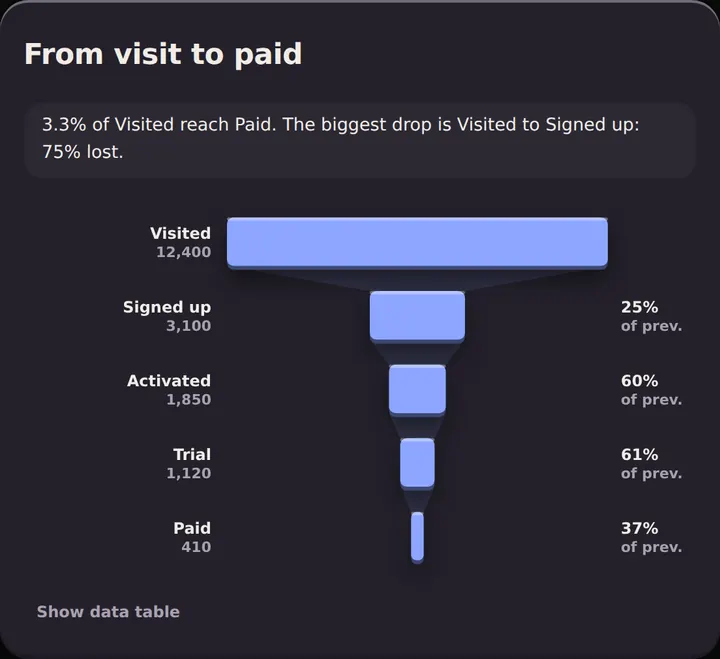
PaidClaySteps in order with the rate from the previous or first step, drop bands, and missing or rising steps named
KPI stat
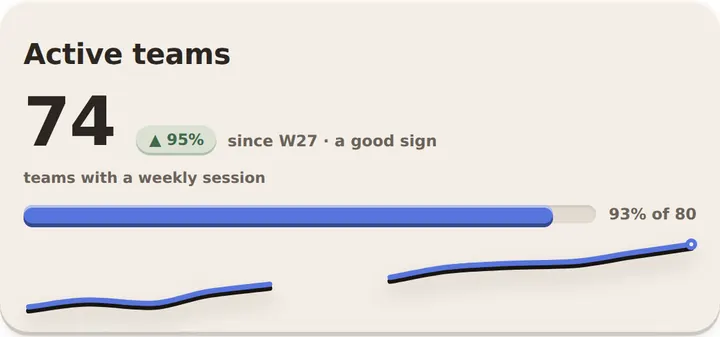
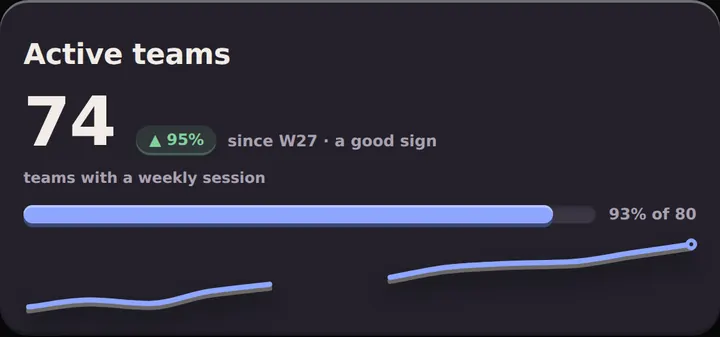
PaidClayOne number with its change in words, an optional target meter and sparkline. Plain SVG: no chart engine
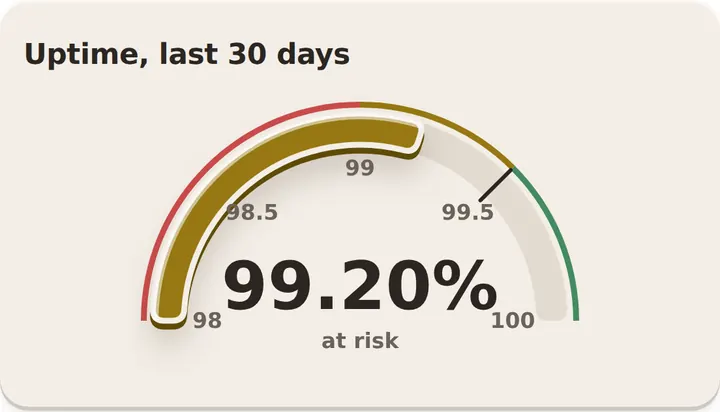
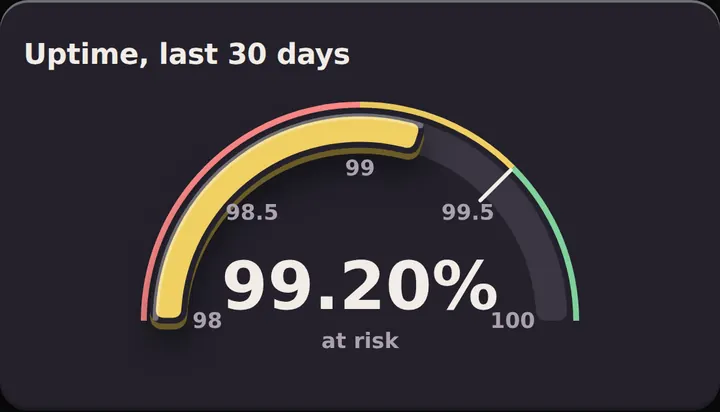
Gauge
PaidClayA meter with bands, a target and honest out-of-range handling. Plain SVG: no chart engine